
Concept explainers
Videos
Reminder Round all answers to two decimal places unless otherwise indicated.
Wind Chill The graph in Figure
a. At what wind speed is the temperature adjusted for wind chill equal to
b. Your answer in part a is the solution of an equation involving T(v). Which equation?
c. At what value of v would a small increase in v have the greatest effect on T(v)? In other words, at what wind speed could you expect a small increase in wind speed to cause the greatest change in wind chill? Explain your reasoning.
d. Suppose the wind speed is 45 miles per hour. Judging from the shape of the graph, how significant would you expect the effect on T(v) to be if the wind speed increased?
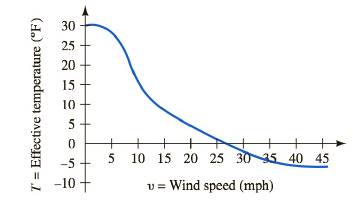
FIGURE
Fahrenheit.
Want to see the full answer?
Check out a sample textbook solution
Chapter 1 Solutions
Functions and Change: A Modeling Approach to College Algebra (MindTap Course List)
Additional Math Textbook Solutions
Algebra and Trigonometry (6th Edition)
Intermediate Algebra for College Students (7th Edition)
Elementary Algebra: Concepts and Applications (10th Edition)
EBK ALGEBRA FOUNDATIONS
College Algebra
Introductory Algebra for College Students (7th Edition)


- Earthquake the graph shows the vertical acceleration of the Ground from the 1994 Northridge earthquake in Los Angles, as measured by a seismograph. (Here t represents the time in seconds.) (a) At what time t did the earthquake first make noticeable movement of the Earth? (b) At what time t did the earthquakes seem to end? (c) At what time t was the maximum intensity of the earthquake list reachedarrow_forwardThe Kelvin Temperature Scale Physicists and chemists often use the Kelvin temperature scale. In order to determine the relationship between the Fahrenheit and Kelvin temperature scales, a lab assistant put Fahrenheit and Kelvin thermometers side by side and took readings at various temperatures. The following data were recorded. K = kelvins F = degrees Fahrenheit 200 -99.67 220 -63.67 240 -27.67 260 8.33 280 44.33 300 80.33 a. Show that the temperature F in degrees Fahrenheit is a linear function of the temperature K in kelvins. b. What is the slope of this linear function? Note: Be sure to take into account that the table lists kelvins in jumps of 20 rather than in jumps of 1. c. Find a formula for the linear function. d. Normal body temperature is 98.6 degrees Fahrenheit. What is that temperature in kelvins? e. If temperature increases by 1 kelvin, by how many degrees Fahrenheit does it increase? If temperature increases by 1 degree Fahrenheit, by how many kelvins does it increase? f. The temperature of 0 kelvins is known as absolute zero. It is not quite accurate to say that all molecular motion ceases at absolute zero, but at that temperature the system has its minimum possible total energy. It is thought that absolute zero cannot be attained experimentally, although temperatures lower than 0.0000001 kelvin have been attained. Find the temperature of absolute zero in degrees Fahrenheit.arrow_forwardTemperature The graph shows the temperature T in degrees Celsius as a function of the altitude h in feet when an inversion layer is over Southern California. An inversion layer is formed when air at a higher altitude, say 300 ft, is warmer than the air at sea level, even though air normally is cooler with increasing altitude. Estimate and interpret the average rate of change in temperature for the following changes in altitude. a. 1000to3000ft b. 1000to5000ft c. 3000to9000ft d. 1000to9000ft e. At what altitude at or below 7000ft is the temperature highest ? Lowest ? How would your answer change if 7000ft is changed to 10,000ft? f. At what altitude is the temperature the same as it is at 1000ft?arrow_forward
- Ripples in a pond When a stone is thrown into the center of a pond, the ripples spread out in a circular pattern, moving at a rate of 3 feet per second. If the stone is dropped at a point (0,0) in the illustration, when will the ripple reach the seagull floating at the point (15,36)?arrow_forwardMortgage Rates The following table is taken from the website of Freddie Mac. It shows rates for 30-year fixed-rate mortgages since 1970. y=Year r=Mortgagerate 1975 9.05 1980 13.74 1985 12.43 1990 10.13 1995 7.93 2000 8.05 2005 5.87 2010 4.69 2015 3.84 a. Explain in practical terms the meaning of r(2003). b. Use the table to estimate the value of r(2003).arrow_forwardPhysician Demand The demand for physicians is expected to increase in the future, as shown in the accompanying table. Source: Association of American Medical Colleges. Year Demand for Physicians in thousands 2006 680.5 2015 758.6 2020 805.8 2025 859.3 a. Plot the data, letting t=0 correspond to 2000. Does fitting an exponential curve to the data seem reasonable? b. Use the data for 2006 and 2015, to find the function of the form f(t)=Cekt that goes through these two points. c. Use your function from part b to predict the demand for physicians in 2020 and 2025. How well do these predictions fit the data? d. If you have graphing calculator or computer program with an exponential regression feature, use it to find an exponential function that approximately fits the data. How does this answer compare with answer to part b?arrow_forward
 Functions and Change: A Modeling Approach to Coll...AlgebraISBN:9781337111348Author:Bruce Crauder, Benny Evans, Alan NoellPublisher:Cengage Learning
 Calculus For The Life SciencesCalculusISBN:9780321964038Author:GREENWELL, Raymond N., RITCHEY, Nathan P., Lial, Margaret L.Publisher:Pearson Addison Wesley,
 Algebra and Trigonometry (MindTap Course List)AlgebraISBN:9781305071742Author:James Stewart, Lothar Redlin, Saleem WatsonPublisher:Cengage Learning
 Algebra & Trigonometry with Analytic GeometryAlgebraISBN:9781133382119Author:SwokowskiPublisher:Cengage
 College AlgebraAlgebraISBN:9781305115545Author:James Stewart, Lothar Redlin, Saleem WatsonPublisher:Cengage Learning
 College Algebra (MindTap Course List)AlgebraISBN:9781305652231Author:R. David Gustafson, Jeff HughesPublisher:Cengage Learning