
Loose Leaf for Foundations of Financial Management Format: Loose-leaf
17th Edition
ISBN: 9781260464924
Author: BLOCK
Publisher: Mcgraw Hill Publishers
expand_more
expand_more
format_list_bulleted
Concept explainers
Videos
Textbook Question
Chapter 13, Problem 24P
Ms. Sharp is looking at a number of different types of investments for her portfolio. She identifies eight possible investments.
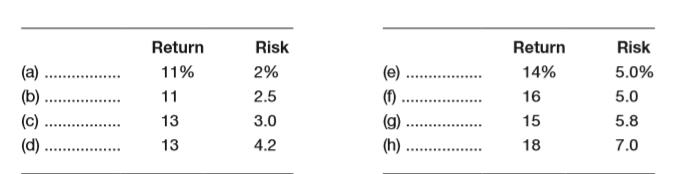
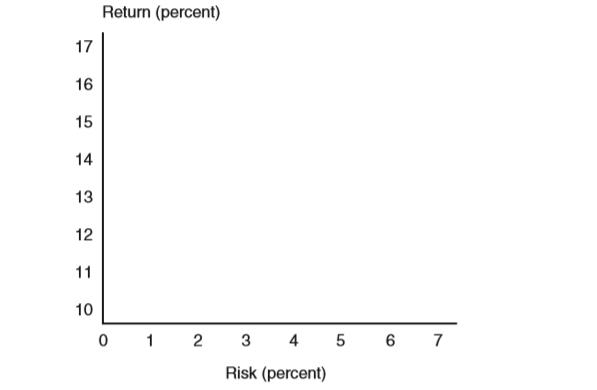
a. Graph the data in a manner similar to Figure 13-10. Use the following axes for your data:
b. Draw a
c. What two objectives do points on the efficient frontier satisfy?
d. Is there one point on the efficient frontier that is best for all investors?
Expert Solution & Answer
Want to see the full answer?
Check out a sample textbook solution
Students have asked these similar questions
Fill the parts in the above table that are shaded in yellow. You will notice that there are nineline items.
Using the data generated in the previous question (Question 1);a) Plot the Security Market Line (SML) b) Superimpose the CAPM’s required return on the SML c) Indicate which investments will plot on, above and below the SML?d) If an investment’s expected return (mean return) does not plot on the SML, what doesit show? Identify undervalued/overvalued investments from the graph
Please answer A, B, C & D
Consider the following two investment proposals and their returns under different economic scenarios.
Answer step by step. Do all calculation. Answer must be correct. Use word file for answer. Answer follow image
Ahsan, an individual investor, is evaluating the investment opportunity. To evaluate this investment, he
collected the relevant data and has estimated the following result and their likelihood (probability). There are
three possible results and each of them will generate a different return.
Outcome
Probability
Rate of Return
A
30%
50%
B.
50%
30%
20%
70%
a. Calculate the expected rate of return for the investor.
b. What is the importance/relevance of expected rate of return?
Answer:
Chapter 13 Solutions
Loose Leaf for Foundations of Financial Management Format: Loose-leaf
Ch. 13 - Prob. 1DQCh. 13 - Discuss the concept of risk and how it might be...Ch. 13 - When is the coefficient of variation a better...Ch. 13 - Explain how the concept of risk can be...Ch. 13 - If risk is to be analyzed in a qualitative way,...Ch. 13 - Assume a company, correlated with the economy, is...Ch. 13 - Assume a firm has several hundred possible...Ch. 13 - Explain the effect of the risk-return trade-off on...Ch. 13 - What is the purpose of using simulation analysis?...Ch. 13 - Assume you are risk-averse and have the following...
Ch. 13 - Myers Business Systems is evaluating the...Ch. 13 - Prob. 3PCh. 13 - Prob. 4PCh. 13 - Prob. 5PCh. 13 - Possible outcomes for three investment...Ch. 13 - Prob. 7PCh. 13 - Prob. 8PCh. 13 - Prob. 9PCh. 13 - Prob. 10PCh. 13 - Prob. 12PCh. 13 - Waste Industries is evaluating a 70,000 project...Ch. 13 - Prob. 14PCh. 13 - Debby’s Dance Studios is considering the...Ch. 13 - Prob. 17PCh. 13 - Prob. 18PCh. 13 - Allison’s Dresswear Manufacturers is preparing a...Ch. 13 - Prob. 20PCh. 13 - Prob. 21PCh. 13 - Prob. 22PCh. 13 - Ms. Sharp is looking at a number of different...Ch. 13 - Prob. 25P
Knowledge Booster


Learn more about
Need a deep-dive on the concept behind this application? Look no further. Learn more about this topic, finance and related others by exploring similar questions and additional content below.Similar questions
- A) Calculate the Return on Investment (ROI) for each of the portfolio. B) Based on the required rate of return, determine the Residual Income (RI)for each of the portfolio. C) If King Bhd is to choose only ONE (1) portfolio to invest in, advise the management team based of your answer in (a). Please provide a calculation for each of them.arrow_forwardPlease slove the question shown in the image. Calculating the rate of return on investment. Please show basic steps of how you derived the answer.arrow_forwardPLEASE ANSWER ALL THE QUESTIONS Question 1 Fill the parts in the above table that are shaded in yellow. You will notice that there are nine line items. Question 2 Using the data generated in the previous question (Question 1);a) Plot the Security Market Line (SML) b) Superimpose the CAPM’s required return on the SML c) Indicate which investments will plot on, above and below the SML? d) If an investment’s expected return (mean return) does not plot on the SML, what does it show? Identify undervalued/overvalued investments from the graph Question 3 From the information generated in the previous two questions; a) Identify two investment alternatives that can be combined in a portfolio. Assume a 50-50 investment allocation in each investment alternative. b) Compute the expected return of the portfolio thus formed. c) Compute the portfolio’s beta. Is the portfolio aggressive or defensive?arrow_forward
- Sharon Smith, the financial manager for Barnett Corporation, wishes to select one of three prospective investments: X, Y, and Z. Assume that the measure of risk Sharon cares about is an asset's standard deviation. The expected returns and standard deviations of the investments are as follows: Investment Expected return Standard deviation X 17% 7% Y 17% 8% Z 17% 9% a. If Sharon were risk neutral, which investment would she select? Explain why. b. If she were risk averse, which investment would she select? Why? c. If she were risk seeking, which investments would she select? Why? d. Suppose a fourth investment, W, is available. It offers an expected return of 18%,and it has a standard deviation of 9%. If Sharon is risk averse, can you say which investment she will choose? Why or why not? Are there any investments that you are certain she will not choose?arrow_forwardThe Excel spreadsheet is the “optimizer” for the average investor. What are the primary benefits of using Excel portfolio optimization analysis? How would you optimize your portfolio using Excel?arrow_forward3. What are the different investments? a. Create a diagram showing all possible investments. b. Which of the following investments are you considering to invest in? c. Which of the following investments are you NOT considering?arrow_forward
- Discuss the five inputs that are needed for the Black-Scholes estimations and shows its relevance to investors.arrow_forwardThe expected rate of return of an investment ________. a. equals one of the possible rates of return for that investment b. equals the required rate of return for the investment c. is the mean value of the probability distribution of possible returns d. is the median value of the probability distribution of possible returns e. is the mode value of the probability distribution of possible returnsarrow_forwardJason Jackson is attempting to evaluate two possible portfolios consisting of the same five assets but held in different proportions. He is particularly interested in using beta to compare the risk of the portfolios and, in this regard, has gathered the following data: LOADING... . a. Calculate the betas for portfolios A and B. b. Compare the risk of each portfolio to the market as well as to each other. Which portfolio is more risky? Question content area bottom Part 1 Data table (Click on the icon here in order to copy its contents of the data table below into a spreadsheet.) Portfolio Weights Asset Asset Beta Portfolio A Portfolio B 1 1.35 17% 29% 2 0.69 26% 8% 3 1.24 10% 22% 4 1.06 11% 20% 5 0.87 36% 21% Total 100% 100% a. The beta of portfolio A is enter your response here. (Round to three…arrow_forward
- using the chart, how much should the call option worth. please show how to solve this in excel and the formulasarrow_forwardP 9-2 Investment Scenarios (LO 9-3) Arkansas Best Freightways is considering a purchase of three different potential trucks but is uncertain of the cash inflows associated with the following investment scenarios. Year Year 0 (today) Year 1 Year 2 Year 3 Year 4 Buy new truck Increased profits Increased profits Increased profits Increased profits Investment 1 (85,000) 25,000 25,000 25,000 25,000 Investment 2 (105,000) 20,000 30,000 40,000 50,000 Investment 3 (125,000) 40,000 30,000 20,000 10,000arrow_forward6. Use Excel, Calculator, and Formula. Show your work. Based on the data below, estimate the following: E(r) = [Probability of Economic State x Return in Economic State 0² (r) = [[Return in State; - E(r)]³ x Probability of State; a. Estimate the expected return and risk of Asset A (TESLA) b. Estimate the Expected Return and risk of Asset B (APPLE) c. Estimate the Expected return and risk of a 60A and 40B portfolio d. Summarize your results and determine whether the Portfolio Diversification helped decrease the investment risk. Explain your answer. State of the Economy Probability of Economic State S Pr 1 N 0.6 Return In Economic State TESLA APPLE R R 0.27 -0.10 -0.15 0.35arrow_forward
arrow_back_ios
SEE MORE QUESTIONS
arrow_forward_ios
Recommended textbooks for you

Portfolio Management; Author: DevTechFinance;https://www.youtube.com/watch?v=Qmw15cG2Mv4;License: Standard YouTube License, CC-BY