Concept explainers
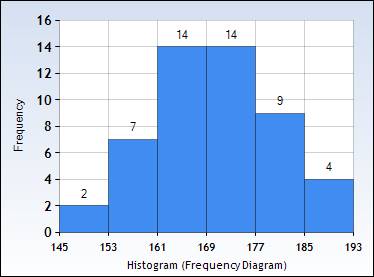
To construct: The appropriate graph for the provided data and describe the centre, shape and variability of the data. Also, check whether there any outliers exists in the data set.
Explanation of Solution
Given:
The data set is:
| 166.5 | 160 |
| 170 | 174 |
| 178 | 182 |
| 163 | 167 |
| 150.5 | 166 |
| 169 | 170 |
| 173 | 170 |
| 169 | 181 |
| 171 | 171.5 |
| 166 | 160 |
| 190 | 178 |
| 183 | 157 |
| 178 | 165 |
| 161 | 187 |
| 171 | 168 |
| 191 | 157.5 |
| 168.5 | 145.5 |
| 178.5 | 156 |
| 173 | 182 |
| 175 | 168.5 |
| 160.5 | 177 |
| 166 | 162.5 |
| 164 | 160.5 |
| 163 | 185.5 |
| 174 | 170 |
Graph:
The histogram could be constructed as:

Interpretation:
The above constructed histogram is approximately
Chapter 1 Solutions
PRACTICE OF STATISTICS F/AP EXAM
Additional Math Textbook Solutions
Introductory Statistics
Calculus: Early Transcendentals (2nd Edition)
University Calculus: Early Transcendentals (4th Edition)
Pre-Algebra Student Edition
Thinking Mathematically (6th Edition)
A Problem Solving Approach To Mathematics For Elementary School Teachers (13th Edition)
 MATLAB: An Introduction with ApplicationsStatisticsISBN:9781119256830Author:Amos GilatPublisher:John Wiley & Sons Inc
 Probability and Statistics for Engineering and th...StatisticsISBN:9781305251809Author:Jay L. DevorePublisher:Cengage Learning
 Statistics for The Behavioral Sciences (MindTap C...StatisticsISBN:9781305504912Author:Frederick J Gravetter, Larry B. WallnauPublisher:Cengage Learning
 Elementary Statistics: Picturing the World (7th E...StatisticsISBN:9780134683416Author:Ron Larson, Betsy FarberPublisher:PEARSON
 The Basic Practice of StatisticsStatisticsISBN:9781319042578Author:David S. Moore, William I. Notz, Michael A. FlignerPublisher:W. H. Freeman
 Introduction to the Practice of StatisticsStatisticsISBN:9781319013387Author:David S. Moore, George P. McCabe, Bruce A. CraigPublisher:W. H. Freeman


