
Concept explainers
Videos
a.
To describe what the graph reveals about the relationship between age group and use of smartphones for navigation.
a.
Answer to Problem 35E
The age group that is most likely to use smartphone for navigation are the 18 to 29 year olds.
The age group that is least likely to use smartphone for navigation are the 65+ year olds.
The majority of the 18 to 64 year olds appear to use smartphones for navigation.
The majority of the 65+ year olds appear to not use smartphones for navigation.
Explanation of Solution
Given the bar graph below that displays data on the percentage of smartphone owners in several age groups who say that they use their phone for turn-by-turn navigation.
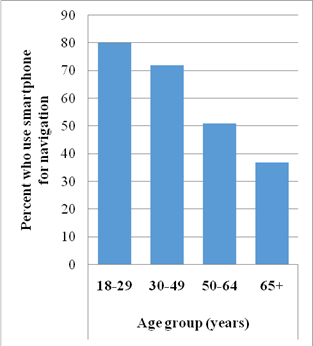
The age group that is most likely to use smartphone for navigation are the 18 to 29 year olds, because the highest bar in the bar graph corresponds to the category "18-29".
The age group that is least likely to use smartphone for navigation are the 65+ year olds, because the lowest bar in the bar graph corresponds to the category "65+".
The majority of the 18 to 64 year olds appear to use smartphones for navigation, because each of the bars corresponding to these categories have a height of at least 50.
The majority of the 65+ year olds appear to not use smartphones for navigation, because the bar corresponding to this age category has a height that is less than 50.
b.
To find out and explain would it be appropriate to make a pie chart of the data given.
b.
Answer to Problem 35E
Not appropriate to make a pie chart of the data given.
Explanation of Solution
In the bar graph, we note that approximately 80% of the 18-29 year olds, 72% of the 30-49 year olds, 51% of the 50-64 year olds and 37 % of the 65+ year old use smartphones for navigation.
If we would then add all these percentages, then we would obtain more than 100% and thus it won't be appropriate to construct a pie chart.
Moreover, you can also notice that a pie chart is not appropriate due to the different bars not representing a part of the same whole (as each age category is considered separately).
Chapter 1 Solutions
PRACTICE OF STATISTICS F/AP EXAM
Additional Math Textbook Solutions
Elementary Statistics: Picturing the World (7th Edition)
STATS:DATA+MODELS-W/DVD
Basic Business Statistics, Student Value Edition (13th Edition)
Introductory Statistics
Statistics for Psychology
An Introduction to Mathematical Statistics and Its Applications (6th Edition)


 MATLAB: An Introduction with ApplicationsStatisticsISBN:9781119256830Author:Amos GilatPublisher:John Wiley & Sons Inc
 Probability and Statistics for Engineering and th...StatisticsISBN:9781305251809Author:Jay L. DevorePublisher:Cengage Learning
 Statistics for The Behavioral Sciences (MindTap C...StatisticsISBN:9781305504912Author:Frederick J Gravetter, Larry B. WallnauPublisher:Cengage Learning
 Elementary Statistics: Picturing the World (7th E...StatisticsISBN:9780134683416Author:Ron Larson, Betsy FarberPublisher:PEARSON
 The Basic Practice of StatisticsStatisticsISBN:9781319042578Author:David S. Moore, William I. Notz, Michael A. FlignerPublisher:W. H. Freeman
 Introduction to the Practice of StatisticsStatisticsISBN:9781319013387Author:David S. Moore, George P. McCabe, Bruce A. CraigPublisher:W. H. Freeman