a.
To construct: The histogram for the provided data set. Also, check whether the data set is skewed to the right.
a.
Explanation of Solution
Given:
The data set is given.
Graph:
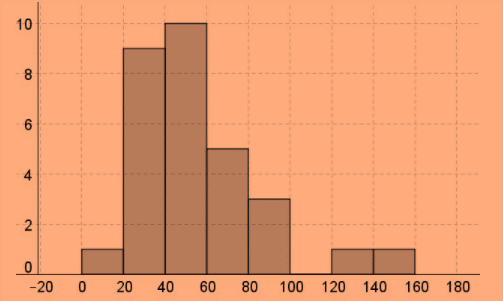
The histogram is constructed as:

Interpretation:
Here, most of the data is lying on the right side of the graph. Thus, it is skewed to the right.
b.
To find: Whether there any outlier exists.
b.
Explanation of Solution
From the above constructed histogram, it is clear that there is one value which is on distance of the other values.
The outlier is 151.
c.
To explain: Whether mean and standard deviation or IQR and
c.
Explanation of Solution
From the above part, it is clear that the outlier exists in the data set. Thus, the IQR and median should be calculated here because these both are least affected by the extreme values.
Chapter 1 Solutions
PRACTICE OF STATISTICS F/AP EXAM
Additional Math Textbook Solutions
Algebra and Trigonometry (6th Edition)
University Calculus: Early Transcendentals (4th Edition)
Pre-Algebra Student Edition
Basic Business Statistics, Student Value Edition
Calculus: Early Transcendentals (2nd Edition)
Elementary Statistics (13th Edition)
 MATLAB: An Introduction with ApplicationsStatisticsISBN:9781119256830Author:Amos GilatPublisher:John Wiley & Sons Inc
 Probability and Statistics for Engineering and th...StatisticsISBN:9781305251809Author:Jay L. DevorePublisher:Cengage Learning
 Statistics for The Behavioral Sciences (MindTap C...StatisticsISBN:9781305504912Author:Frederick J Gravetter, Larry B. WallnauPublisher:Cengage Learning
 Elementary Statistics: Picturing the World (7th E...StatisticsISBN:9780134683416Author:Ron Larson, Betsy FarberPublisher:PEARSON
 The Basic Practice of StatisticsStatisticsISBN:9781319042578Author:David S. Moore, William I. Notz, Michael A. FlignerPublisher:W. H. Freeman
 Introduction to the Practice of StatisticsStatisticsISBN:9781319013387Author:David S. Moore, George P. McCabe, Bruce A. CraigPublisher:W. H. Freeman


