
Concept explainers
Videos
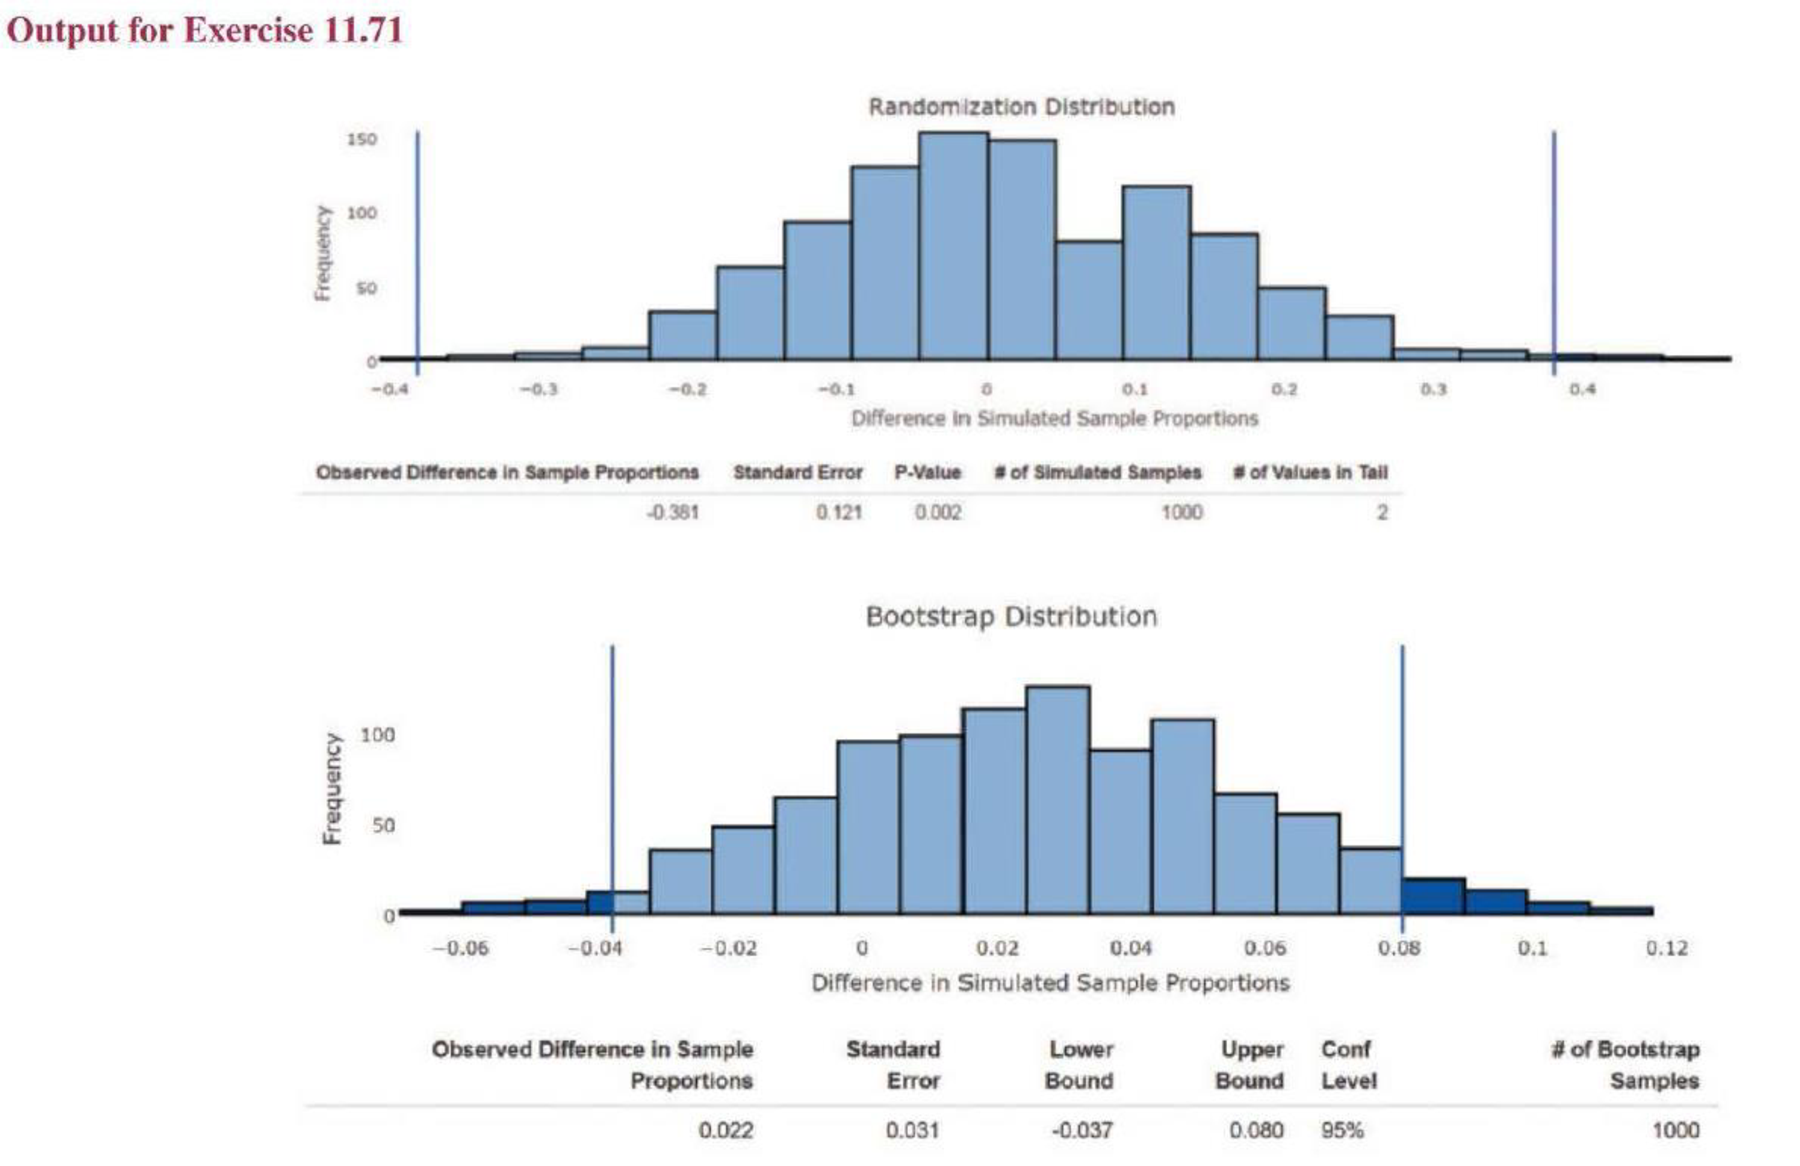
The article “Rapid Evolutionary Response to a Transmissible Cancer in Tasmanian Devils” (nature.com/articles/ncomms12684, retrieved December 20, 2016) describes the spread of devil facial tumor disease (DFTD), which is a fatal form of cancer that swept through the Tasmanian devil population near the beginning of the 21st century. Researchers studied the genetic reaction of the Tasmanian devils by comparing the rates of occurrence of specific genetic markers of interest before and after DFTD swept across the island.
One region of Tasmania is called West Pencil Pine. Analysis of 21 tissue specimens taken from a representative sample of Tasmanian devils living in West Pencil Pine in 2006, before DFTD swept through, revealed that 5% had a specific genetic marker. Also analyzed were 42 tissue specimens from a representative sample of devils living in the same region in 2013 and 2014, after DFTD. In this sample, 43% had the same genetic marker. A significant and substantial change in these rates would indicate a remarkably fast evolution in the genetic code of the Tasmanian devils to protect against DFTD.
- a. Explain why the data from this study should not be analyzed using a large-sample hypothesis test for the difference in two population proportions.
- b. Use the output at the top of the page from the Shiny app “Randomization Test for Two Proportions” to carry out a hypothesis test to determine if there is convincing evidence that the proportion of Tasmanian devils with the genetic marker was greater after DFTD than before DFTD.
- c. Use the output from the Shiny app “Bootstrap Confidence Interval for Difference in Two Proportions” to identify a 95% confidence interval for the difference in the rates of occurrence of the specific genetic marker in the genes of Tasmanian devils, before and after DFTD. Interpret the confidence interval in context.
Want to see the full answer?
Check out a sample textbook solution
Chapter 11 Solutions
Introduction To Statistics And Data Analysis


- Data originally from DASL http://lib.stat.cmu.edu/DASL/Datafiles/CancerSurvival.html (Links to an external site.). Some bronchial cancer patients had the following survival times (in days) after receiving a certain treatment: 20, 37, 63, 64, 72, 81, 138, 151, 155, 166, 166, 223, 245, 246, 450, 459. (The second instance of “166” is not a mistake.) Do these numbers suggest that the average survival time, for all bronchial cancer patients who receive that treatment, is significantly different from 200 days? CANCER SURVIVAL Report an appropriate one-sample hypothesis test and use a 10% significance level. For Step 4 of the six-step process that was taught in this class, choose the BEST option to complete the following sentence: We assume that the sample of subjects is a SRS and we assume that the population of observations has no outliers ... and is Normally distributed. and is without a doubt bell-shaped. and is Uniformly distributed. (nothing needs to go here because the sample…arrow_forwardplease help me out. show full working out for better understanding Hereditary hemochromatosis (HH) is a recessively inherited genetic disorder resulting from mutations in the HFE gene. There are several possible mutations of different degrees of importance but the disease expresses itself only when at least 2 arepresent in any one individual. A blood analysis was performed on 3,000 blood samples from newborn babies of Caucasian descent in the state of Michigan, USA. The results showed that 163 of those sampled carried two mutations in the HFE gene. a. What is the proportion in the sample that carry the two mutations of the HFE gene? b. Calculate the 95% confidence interval for the proportion of this population that carries two mutations in the HFE Check the data for the necessary conditions and show full working. c. Interpret your interval in context d. If the researcher wanted to halve (x ½) the margin of error in the confidence interval found, what sample size would be required…arrow_forwardOne variety of corn is genetically modified to produce chemicals for defense against predators. The standard corn contains the same standard genotype, but without genetic modification for the chemicals. The two types of corn are then planted in randomly placed adjacent plots across a single field. The amount of predators that are present when the corn has matured are then recorded. The data that was recorded of the predators present among each type are listed. Has genetic alterations decreased the amount of predators for the altered genotype? Normality tests for the populations of both contain a p value less than 0.05. The given alpha is 0.05 Modified Corn (20, 18, 26, 23, 17, 23, 22) Standard Corn (89, 64, 102, 96, 56, 77, 84, 59) use an F test to determine if the variance between the 2 lists are different. Based on this result, state the correct 2 sample parametric test to be used. State the null and alternative. Show calculations while rounding to two decimal points.What is the…arrow_forward
- Recent scientific literature has suggested a link between exposure to the endocrine disruptor Bisphenol A (BPA) found ubiquitously in many plastic materials, and precocious puberty in adolescents. The transmission is maternal to child during the last weeks of gestation. Scientists can trace the presence of BPA in children for years after birth, and believe that it may be the cause for early onset of puberty in young girls. Suppose a researcher collects a SRS of 92 girls with high exposure rates of BPA and follows them through puberty. The sample average age of puberty was 9.7 years. Assume the national average age for onset of puberty is 11.2 years with a population standard deviation of 0.6 years. Does the researcher have sufficient evidence at the alpha level of 0.05 to determine if the exposure to BPA has led to a decreased age of puberty in girls? Show all 5 hypothesis testing stepsarrow_forwardPostponing Death An interesting and popular hypothesis is that individuals can temporarily postpone death to survive a major holiday or important event such as a birthday. In a study, it was found that there were 6062 deaths in the week before Thanksgiving, and 5938 deaths the week after Thanksgiving (based on data from “Holidays, Birthdays, and Postponement of Cancer Death,” by Young and Hade, Journal of the American Medical Association, Vol. 292, No. 24). If people can postpone death until after Thanksgiving, then the proportion of deaths in the week before should be less than 0.5. Use a 0.05 significance level to test the claim that the proportion of deaths in the week before Thanksgiving is less than 0.5. Based on the result, does there appear to be any indication that people can temporarily postpone death to survive the Thanksgiving holiday?arrow_forwardData originally from DASL http://lib.stat.cmu.edu/DASL/Datafiles/CancerSurvival.html (Links to an external site.). Some bronchial cancer patients had the following survival times (in days) after receiving a certain treatment: 20, 37, 63, 64, 72, 81, 138, 151, 155, 166, 166, 223, 245, 246, 450, 459. (The second instance of “166” is not a mistake.) Do these numbers suggest that the average survival time, for all bronchial cancer patients who receive that treatment, is significantly different from 200 days? CANCER SURVIVAL Report an appropriate one-sample hypothesis test and use a 10% significance level. For Step 5 of the six-step process that was taught in this class, do the appropriate procedure on your calculator and then choose the correct P-value. Group of answer choices 0.195 0.377 0.805 0.609 0.391arrow_forward
- Data originally from DASL http://lib.stat.cmu.edu/DASL/Datafiles/CancerSurvival.html (Links to an external site.). Some bronchial cancer patients had the following survival times (in days) after receiving a certain treatment: 20, 37, 63, 64, 72, 81, 138, 151, 155, 166, 166, 223, 245, 246, 450, 459. (The second instance of “166” is not a mistake.) Do these numbers suggest that the average survival time, for all bronchial cancer patients who receive that treatment, is significantly different from 200 days? CANCER SURVIVAL Report an appropriate one-sample hypothesis test and use a 10% significance level. For Step 6 of the six-step process that was taught in this class, what would be the final conclusion? Group of answer choices The P-value is low so we cannot conclude that the average survival time is significantly different from 200 days. The P-value is not very low so we cannot conclude that the average survival time is significantly different from 200 days. The P-value is not…arrow_forwardAnemia (low healthy blood cells or hemoglobin) has an important role in exercise performance. However, the direct link between rapid changes of hemoglobin and exercise performance is still unknown. A study investigated 18 patients with a blood disorder (beta-thalassemia). Participants in the study performed an exercise test before and the day after receiving a blood transfusion. Data are given in the table. HB = Hemoglobin RER = Respiratory exchange ID Change in HB Obese RER > 1.1 ratio No No 1 -1.4 No -1.5 No Yes No Yes 3 -2 No 4 -2.1 No -1.9 Yes Yes No -1.6 -1.8 -0.8 6 7 No Yes No Yes 8 9. -1 No No -1.2 No Yes 10 11 No No -0.8 -1.5 12 Yes No No Yes 13 14 -1.4 -2.6 -1.7 No No Yes Yes 15 Yes No Yes Yes 16 -2.6 No 17 18 -2.7 -1.5 Noarrow_forwardIn an observational study it was found that people who had received the flu shot this year had better blood pressure readings, on average, than people who did not. Can it be claimed that the flu shot is the cause of the lower overall blood pressure? Why or why not?arrow_forward
- The data in the attached image represents blood pressure based on a new trial medication used in an experiment involving a total of 50 male and female subjects. There were two levels of treatment: 0 = placebo and 1 = treatment group. Family History Blood Pressure = Fam-Hist-BP; from the paternal side = PS; from the maternal side = MS; from both sides = BS; none on both sides or not known = N.; Blood pressure before the experiment = BP-Before-Exp; Blood pressure after the experiment = BP-After-Exp. Task: Find the mean and standard deviation for the family history group, the before treatment group, and the after treatment group.arrow_forwardThe data in the attached image represents blood pressure based on a new trial medication used in an experiment involving a total of 50 male and female subjects. There were two levels of treatment: 0 = placebo and 1 = treatment group. Family History Blood Pressure = Fam-Hist-BP; from the paternal side = PS; from the maternal side = MS; from both sides = BS; none on both sides or not known = N.; Blood pressure before the experiment = BP-Before-Exp; Blood pressure after the experiment = BP-After-Exp. Task: Construct a scatterplot to display the relationship and find the correlation between age and BP-Before Exp.arrow_forwardThe data in the attached image represents blood pressure based on a new trial medication used in an experiment involving a total of 50 male and female subjects. There were two levels of treatment: 0 = placebo and 1 = treatment group. Family History Blood Pressure = Fam-Hist-BP; from the paternal side = PS; from the maternal side = MS; from both sides = BS; none on both sides or not known = N.; Blood pressure before the experiment = BP-Before-Exp; Blood pressure after the experiment = BP-After-Exp. Task: Construct a histogram to represent the family BP history, the subjects' BP before treatment and the subjects' BP after treatment.arrow_forward
 Calculus For The Life SciencesCalculusISBN:9780321964038Author:GREENWELL, Raymond N., RITCHEY, Nathan P., Lial, Margaret L.Publisher:Pearson Addison Wesley,