
Videos
As part of a study to determine the effects of allowing the use of credit cards for alcohol purchases in Canada (“Changes in Alcohol Consumption Patterns Following the Introduction of Credit Cards in Ontario Liquor Stores,” Journal of Studies on Alcohol [1999]: 378–382), randomly selected individuals were given a questionnaire asking them how many drinks they had consumed during the previous week. A year later (after liquor stores started accepting credit cards for purchases), these same individuals were again asked how many drinks they had consumed in the previous week. The values in the accompanying table are consistent with summary values presented in the article.
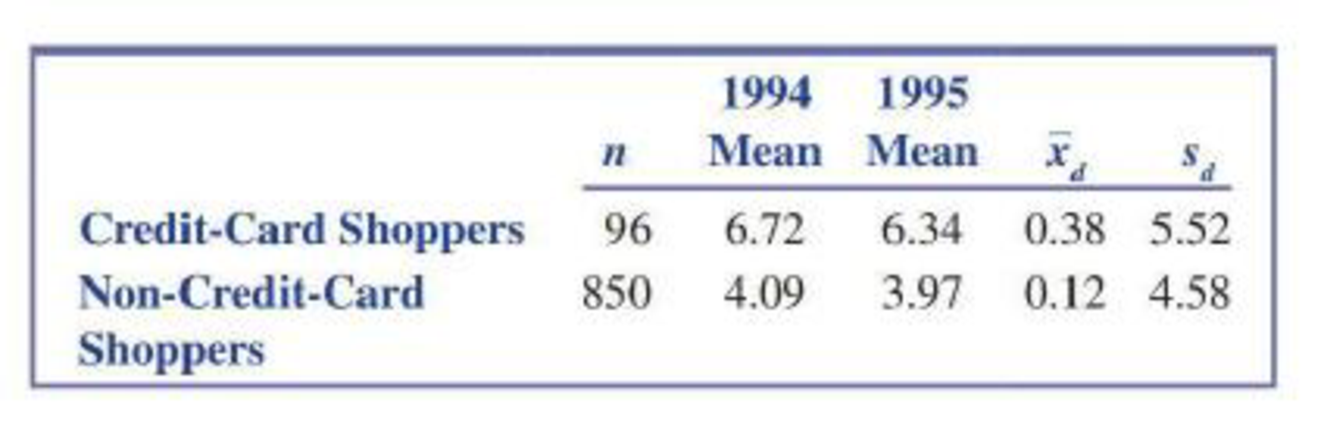
- a. The standard deviations of the differences were quite large. Explain how this could be the case.
- b. Calculate a 95% confidence interval for the
mean difference in drink consumption for credit-card shoppers between 1994 and 1995. Is there evidence that the mean number of drinks decreased? - c. Test the hypothesis that there was no change in the mean number of drinks between 1994 and 1995 for the non-credit-card shoppers. Be sure to calculate and interpret the P-value for this test.

Trending nowThis is a popular solution!

Chapter 11 Solutions
Introduction To Statistics And Data Analysis


 Holt Mcdougal Larson Pre-algebra: Student Edition...AlgebraISBN:9780547587776Author:HOLT MCDOUGALPublisher:HOLT MCDOUGAL
 Glencoe Algebra 1, Student Edition, 9780079039897...AlgebraISBN:9780079039897Author:CarterPublisher:McGraw Hill
 Calculus For The Life SciencesCalculusISBN:9780321964038Author:GREENWELL, Raymond N., RITCHEY, Nathan P., Lial, Margaret L.Publisher:Pearson Addison Wesley,
 College Algebra (MindTap Course List)AlgebraISBN:9781305652231Author:R. David Gustafson, Jeff HughesPublisher:Cengage Learning