
Videos
Do certain behaviors result in a severe drain on energy resources because a great deal of energy is expended in comparison to energy intake? The article “The Energetic Cost of Courtship and Aggression in a Plethodontid Salamander” (Ecology [1983]: 979–983) reported on one of the few studies concerned with behavior and energy expenditure. The accompanying table gives oxygen consumption (mL/g/hr) for male-female salamander pairs.
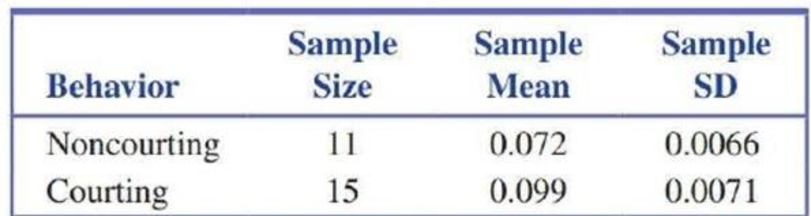
a. The pooled t test is a test procedure for testing H0: μ1 – μ2, = hypothesized value when it is reasonable to assume that the two population distributions are normal with equal standard deviations (σ1 = σ2,). The test statistic for the pooled t test is obtained by replacing both s1 and s2 in the two-sample t test statistic with sp where
When the population distributions are normal with equal standard deviations and H0 is true, the resulting pooled t statistic has a t distribution with df = n1 + n2 – 2. For the reported data, the two sample standard deviations are similar. Use the pooled t test with α = 0.05 to determine whether the
b. Would the conclusion in Part (a) have been different if the two-sample t test had been used rather than the pooled t test?

Trending nowThis is a popular solution!

Chapter 11 Solutions
Introduction To Statistics And Data Analysis


- Urban Travel Times Population of cities and driving times are related, as shown in the accompanying table, which shows the 1960 population N, in thousands, for several cities, together with the average time T, in minutes, sent by residents driving to work. City Population N Driving time T Los Angeles 6489 16.8 Pittsburgh 1804 12.6 Washington 1808 14.3 Hutchinson 38 6.1 Nashville 347 10.8 Tallahassee 48 7.3 An analysis of these data, along with data from 17 other cities in the United States and Canada, led to a power model of average driving time as a function of population. a Construct a power model of driving time in minutes as a function of population measured in thousands b Is average driving time in Pittsburgh more or less than would be expected from its population? c If you wish to move to a smaller city to reduce your average driving time to work by 25, how much smaller should the city be?arrow_forwardIn a study, the effects of the mane of a male lion as a signal of quality to mates and rivals was explored. Four life-sized dummies of male lions provided a tool for testing female response to the unfamiliar lions whose manes varied by length (long or short) and color (blonde or dark). The female lions were observed to see whether they approached each of the four life-sized dummies. Complete parts (a) through (e) below. a. Identify the experimental units. Choose the correct answer below. The female lions The male dummies The mane colors The mane lengths Part 2 b. Identify the response variable. Choose the correct answer below. A. Whether or not (yes or no) the mane length affected how the female lions reacted to a male dummy. B. Whether or not (yes or no) the female lions approached the same dummies. C. Whether or not (yes or no) the female lions approached a male dummy. D. Whether or not…arrow_forwardThe Journal of Engineering in Industry (Aug. 1993) reported on an automated system designed to replace the cutting tool of a drilling machine at optimum times. To test the system, data were collected over a broad range of materials, drill sizes, drill speeds, and feed rates – called machining conditions. Although a total of 168 different machining conditions were possible, only eight were employed in this study. These are described below: Experiment Workpiece Drill Size (in.) 25 25 Drill Speed (грт) 1250 1800 Feed Rate Material (ipr) .011 .005 1 Cast Iron Cast Iron Steel Steel 25 25 3750 2500 .003 .003 .008 4 Steel 25 .125 .125 2500 Steel Steel 4000 4000 3000 .0065 .009 .010 Steel .125 a. Suppose one (and only one) of the 168 possible machining conditions will detect a flaw in the system. What is the probability that the experiment conducted in the study will detect the system flaw? b. Suppose the system flaw occurs when drilling steel material with a 25-inch drill size at a speed of…arrow_forward
- The Lion’sMane. In a study by P. M.West titled “The Lion’s Mane” (American Scientist, Vol. 93, No. 3, pp. 226–236), the effects of the mane of a male lion as a signal of quality to mates and rivals was explored. Four life-sized dummies of male lions provided a tool for testing female response to the unfamiliar lions whose manes varied by length (long or short) and color (blonde or dark). The female lions were observed to see whether they approached each of the four life-sized dummies. a. experimental units. b. response variable. c. factor(s). d. levels of each factor. e. treatments.arrow_forwardArchaeologists can determine the diets of ancient civilizations by measuring the ratio of carbon-13 to carbon-12 in bones found at burial sites. Large amounts of carbon-13 suggest a diet rich in grasses such as maize, while small amounts suggest a diet based on herbaceous plants. The article "Climate and Diet in Fremont Prehistory: Economic Variability and Abandonment of Maize Agriculture in the Great Salt Lake Basin" (J. Coltrain and S. Leavitt, American Antiquity, 2002:453-485) reports ratios, as a difference from a standard in units of parts per thousand, for bones from individuals in several age groups. The data are presented in the following table. Ratio Age Group (years) 0-11 17.2 18.4 17.9 16.6 19.0 18.3 13.6 13.5 18.5 19.1 19.1 13.4 12-24 14.8 17.6 18.3 17.2 10.0 11.3 10.2 17.0 18.9 19.2 25-45 18.4 13.0 14.8 18.4 12.8 17.6 18.8 179 18.5 17.5 18.3 15.2 10.8 19.8 1 19.2 15.4 13.2 46+ 15.5 18.2 12.7 15.1 18.2 18.0 14.4 10.2 16.7 Construct an ANOVA table. You may give a range for…arrow_forwardThe Great White Shark. In an article titled “Great White, Deep Trouble” (National Geographic, Vol. 197(4), pp. 2–29), Peter Benchley—the author of JAWS—discussed various aspects of the Great White Shark (Carcharodon carcharias). Data on the number of pups borne in a lifetime by each of 80 Great White Shark females are provided on the WeissStats site. Use the technology of your choice to a. obtain frequency and relative-frequency distributions, using single-value grouping. b. construct and interpret either a frequency histogram or a relativefrequency histogram.arrow_forward
- Health care workers who use latex gloves with glove powder on a daily basis are particularly susceptible to developing a latex allergy. Each in a sample of 47 hospital employees who were diagnosed with a latex allergy based on a skin-prick test reported on their exposure to latex gloves. Summary statistics for the number of latex gloves used per week are x = 19.3 and s = 12.3. Complete parts (a) - (d). a. Give a point estimate for the average number of latex gloves used per week by all health care workers with a latex allergy. b. Form a 95% confidence interval for the average number of latex gloves used per week by all health care workers with a latex allergy. (Use integers or decimals for any numbers in the expression. Round to two decimal places as needed.) с. Gi a practical interpretation of the interval, part (b). A. One can be 95% confident that latex gloves cause allergies for all who use a number of gloves contained in the interval. B. One can be 95% confident that the average…arrow_forwardWelsh, Davis, Burke, and Williams (2002) conducted a study to evaluate the effectiveness of a carbohydrate-electrolyte drink on sports performance and endurance. Experienced athletes were given either a carbohydrate-electrolyte drink or a placebo while they were tested on a series of high-intensity exercises. One measure was how much time it took for the athletes to run to fatigue. Data similar to the results obtained in the study are shown in the following table. Time to Run to Fatigue (in minutes) Mean SE Placebo 21.7 2.2 Carbohydrate- electrolyte 28.6 2.7 a) Construct a bar graph that incorporates all of the information in the table. b) Looking at your graph, do you think that the carbohydrate-electrolyte drink helps performance?arrow_forwardHealth care workers who use latex gloves with glove powder on a daily basis are particularly susceptible to developing a latex allergy. Each in a sample of 45 hospital employees who were diagnosed with a latex allergy based on a skin-prick test reported on their exposure to latex gloves. Summary statistics for the number of latex gloves used per week are x = 19.5 and s = 12.1. Complete parts (a) - (d). a. Give a point estimate for the average number of latex gloves used per week by all health care workers with a latex allergy. 19.5 b. Form a 95% confidence interval for the average number of latex gloves used per week by all health care workers with a latex allergy. (Use integers or decimals for any numbers in the expression. Round to two decimal places as needed.)arrow_forward
- 5.1 Application: Yo. e Here is data for the amount of fat (in grams) for McDonald's chicken sandwiches: Sandwich McChicken Ⓒ Premium Grilled Chicken Classic Sandwich Premium Crispy Chicken Classic Sandwich Premium Grilled Chicken Club Sandwich Premium Crispy Chicken Club Sandwich Premium Grilled Chicken Ranch BLT Sandwich Premium Crispy Chicken Ranch BLT Sandwich Southern Style Crispy Chicken Sandwich Ranch Snack Wrap (Crispy) Ranch Snack Wrap (Grilled) Honey Mustard Snack Wrap (Crispy). Honey Mustard Snack Wrap (Grilled) Chipotle BBQ Snack Wrap (Crispy) Chipotle BBQ Snack Wrap (Grilled) Find the median and IQR. M = type your answer... IQR= type your answer... C 54 do 5 % Fat 16 g 10 g 20 g 17 g 28 g 12 g 23 g 17 g 17 g 10 g 16 g 99 15 g 99 A 6 g g DELL & 7 O 8 O ( 9 % ) 0arrow_forwardHealth care workers who use latex gloves with glove powder on a daily basis are particularly susceptible to developing a latex allergy. Each in a sample of 47 hospital employees who were diagnosed with a latex allergy based on a skin-prick test reported on their exposure to latex gloves. Summary statistics for the number of latex gloves used per week are x = 19.7 and s = 12.1. Complete parts (a)-(d). a. Give a point estimate for the average number of latex gloves used per week by all health care workers with a latex allergy. 19.7 b. Form a 95% confidence interval for the average number of latex gloves used per week by all health care workers with a latex allergy. (16.24, 23.16) (Use integers or decimals for any numbers in the expression. Round to two decimal places as needed.) c. Give a practical interpretation of the interval, part (b). OA. One can be 95% confident that the average number of latex gloves used per week by all healthcare workers with latex allergy is greater than the…arrow_forward
 Linear Algebra: A Modern IntroductionAlgebraISBN:9781285463247Author:David PoolePublisher:Cengage Learning
 Functions and Change: A Modeling Approach to Coll...AlgebraISBN:9781337111348Author:Bruce Crauder, Benny Evans, Alan NoellPublisher:Cengage Learning
 Calculus For The Life SciencesCalculusISBN:9780321964038Author:GREENWELL, Raymond N., RITCHEY, Nathan P., Lial, Margaret L.Publisher:Pearson Addison Wesley,
 Glencoe Algebra 1, Student Edition, 9780079039897...AlgebraISBN:9780079039897Author:CarterPublisher:McGraw Hill