
Videos
1.
Compute the time interest earned for Company E.
1.
Explanation of Solution
Times interest earned ratio:
Times interest earned quantifies the number of times the earnings before interest and taxes can pay the interest expense.
Compute the time interest earned for Company E.
Therefore, time interest earned by Company E is 1.33.
2.
Compute the time interest earned for Company S.
2.
Explanation of Solution
Times interest earned ratio:
Times interest earned quantifies the number of times the earnings before interest and taxes can pay the interest expense.
Compute the time interest earned for Company S.
Therefore, time interest earned by Company S is 2.0.
3.
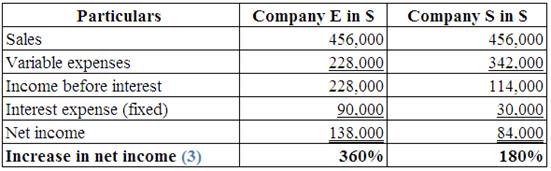
Identify the effect of increase in sales by 10%, on each company’s net income.
3.
Explanation of Solution
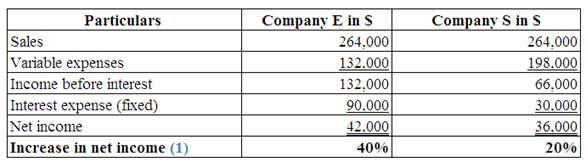
(Table 1)
Note:
Multiply the prior sales by 1.10
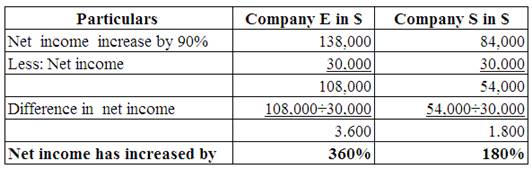
Working Note:
Calculate the increase in the value of net income.
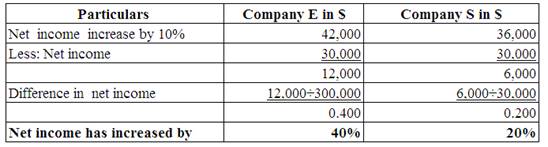
(Table 2)
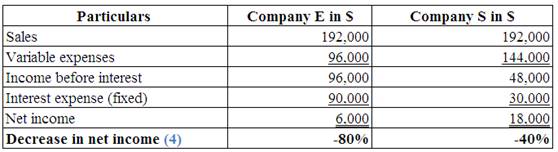
4.
Identify the effect of increase in sales by 40%, on each company’s net income.
4.
Explanation of Solution
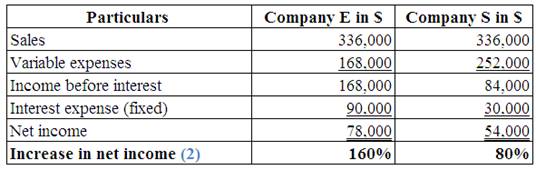
(Table 3)
Note:
Multiply the prior sales by 1.40
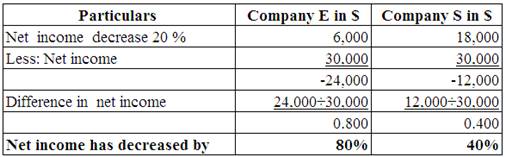
Working Note:
Calculate the increase in the value of net income.
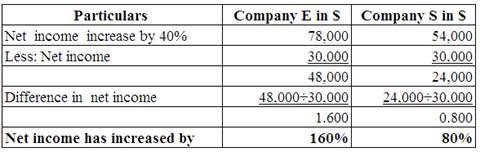
(Table 4)
5.
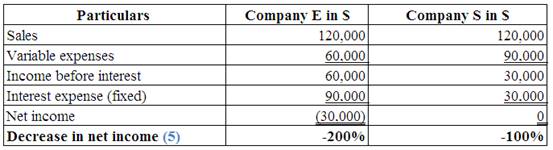
Identify the effect of increase in sales by 90%, on each company’s net income.
5.
Explanation of Solution
(Table 5)
Note:
Multiply the prior sales by 1.90
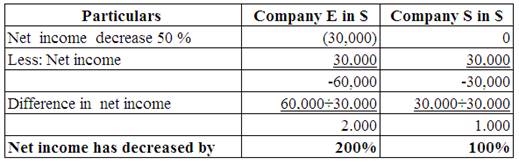
Working Note:
Calculate the increase in the value of net income.
(Table 6)
6.
Identify the effect of decreases in sales by 20%, on each company’s net income.
6.
Explanation of Solution
(Table 7)
Note:
Multiply the prior sales by 0.80
Working Note:
Calculate the increase in the value of net income.
(Table 8)
7.
Identify the effect of decreases in sales by 50%, on each company’s net income.
7.
Explanation of Solution
(Table 9)
Note:
Multiply the prior sales by 0.50
Working Note:
Calculate the increase in the value of net income.
(Table 10)
8.
Identify the effect of decreases in sales by 80%, on each company’s net income.
8.
Explanation of Solution
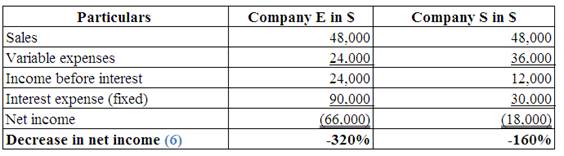
(Table 11)
Note:
Multiply the prior sales by 0.20
Working Note:
Calculate the increase in the value of net income.
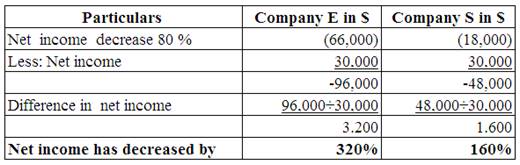
(Table 12)
9.
Comment on the results from requirement 3 through 8 in relation to the fixed-cost strategies of the two companies and the ratio values computed under requirement 1 and 2.
9.
Explanation of Solution
The higher fixed cost strategy of Company E shows the effect of increases and decreases in the value of sales. When sales increase, the value of net income increases. When sales decrease, the value of net income decreases. The higher fixed cost strategy of Company E is indicated by a lower value of the times interest earned ratio.
The higher fixed cost strategy works goods when there is increase in sales. Therefore, Company E enjoys has greater percent increases in the value of its net income. The Company is protected with the lower fixed cost strategy, when there is a decrease in sales level. Company S experiences smaller percent decreases in the value of net income because it has made this choice.
Want to see more full solutions like this?
Chapter 11 Solutions
Principles of Financial Accounting.


- Brandt Corporation had sales revenue of 500,000 for the current year. For the year, its cost of goods sold was 240,000, its operating expenses were 50,000, its interest revenue was 2,000, and its interest expense was 12,000. Brandts income tax rate is 30%. Prepare Brandts multiple-step income statement for the current year.arrow_forwardYou are considering two possible companies for investment purposes. The following data is available for each company. Additional Information: Company A: Bad debt estimation percentage using the income statement method is 6%, and the balance sheet method is 10%. The $230,000 in Other Expenses includes all company expenses except Bad Debt Expense. Company B: Bad debt estimation percentage using the income statement method is 6.5%, and the balance sheet method is 8%. The $140,000 in Other Expenses includes all company expenses except Bad Debt Expense. A. Compute the number of days sales in receivables ratio for each company for 2019 and interpret the results (round answers to nearest whole number). B. If Company A changed from the income statement method to the balance sheet method for recognizing bad debt estimation, how would that change net income in 2019? Explain (show calculations). C. If Company B changed from the balance sheet method to the income statement method for recognizing bad debt estimation, how would that change net income in 2019? Explain (show calculations). D. What benefits do each company gain by changing their method of bad debt estimation? E. Which company would you invest in and why? Provide supporting details.arrow_forwardGrammatico Company has just completed its third year of operations. The income statement is as follows: Selected information from the balance sheet is as follows: Required: Note: Round answers to two decimal places. 1. Compute the times-interest-earned ratio. 2. Compute the debt ratio. 3. CONCEPTUAL CONNECTION Assume that the lower quartile, median, and upper quartile values for debt and times-interest-earned ratios in Grammaticos industry are as follows: How does Grammatico compare with the industrial norms? Does it have too much debt?arrow_forward
- The income statement, statement of retained earnings, and balance sheet for Somerville Company are as follows: Includes both state and federal taxes. Refer to the information for Somerville Company on the previous pages. Also, assume that the price per common share for Somerville is 8.10. Required: Compute the price-earnings ratio. (Note: Round the answer to two decimal places.)arrow_forwardUse the following income statement of Elliott Game Theory Consulting to determine its net operating profit after taxes (NOPAT). Use 25% as the tax rate. Elliott Game Theory Consulting Income Statement for Year Ending December 31arrow_forwardAnalyze and compare Zynga, Electronic Arts, and Take-Two Data (in millions) from recent financial statements of Zynga Inc. (ZNGA), Electronic Arts Inc. (EA), and Take-Two Interactive Software, Inc. (TTWO) are as follows: a. Compute the working capital for Year 2 and Year 1 for each company. b. Which company has the largest working capital? c. Compute the current ratio for Year 2 and Year 1 for each company. Round to one decimal place. d. For Year 2, rank the companies from most liquid to least liquid based upon the current ratio.arrow_forward
- Mike Sanders is considering the purchase of Kepler Company, a firm specializing in the manufacture of office supplies. To be able to assess the financial capabilities of the company, Mike has been given the companys financial statements for the 2 most recent years. Required: Note: Round all answers to two decimal places. 1. Compute the following for each year: (a) return on assets, (b) return on stockholders equity, (c) earnings per share, (d) price-earnings ratio, (e) dividend yield, and (f ) dividend payout ratio. 2. CONCEPTUAL CONNECTION Based on the analysis in Requirement 1, would you invest in the common stock of Kepler?arrow_forwardReturn on assets The following data (in millions) were adapted from recent financial statements of Tootsie Roll Industries Inc. (TR): The percent a company adds to its cost of sales to determine selling price is called a markup. What is Tootsie Roll’s markup percent? Round to one decimal place.arrow_forwardThe average liabilities, average stockholders' equity, and average total assets are as follows: 1. Determine the following ratios for both companies, rounding ratios and percentagesto one decimal place: a. Return on total assets b. Return on stockholders' equity c. Times interest earned d. Ratio of total liabilities to stockholders' equity 2. Based on the information in (1), analyze and compare the two companies'solvency and profitability. Comprehensive profitability and solvency analysis Marriott International, Inc., and Hyatt Hotels Corporation are two major owners and managers of lodging and resort properties in the United States. Abstracted income statement information for the two companies is as follows for a recent year (in millions): Balance sheet information is as follows:arrow_forward
- Comparing Two Companies in the Same Industry: Chipotle and Panera Bread This case should be completed after responding to the requirements in Decision Case 13-2. Refer to the financial statement information of Chipotle and Panera Bread reprinted at the back of the book. Required Using the format in Example 13-5, prepare common-size comparative income statements for 2014 and 2013, for Panera Bread. Use total revenues as the base (i.e., 100%). Round all percentages to the nearest one-tenth of a percent. The common-size comparative income statements indicate the relative importance of items on the statement. Compare the common-size income statements of Panera Bread and Chipotle. What are the most important differences between the two companies income statements? Using the format in Example 13-4, prepare common-size comparative balance sheets at the end of 2014 and 2013, for Panera Bread. Round all percentages to the nearest one-tenth of a percent. The common-size comparative balance sheets indicate the relative importance of items on the statement. Compare the common-size balance sheets of Panera Bread and Chipotle. What are the most important differences between the two companies balance sheets?arrow_forwardFedEx Corporation had the following revenue and expense account balances (in millions) for a recent year ending May 31: a.Prepare an income statement. b.Compare your income statement with the income statement that is available at the FedEx Corporation Web site, (http://investors.fedex.com). Click on Annual Report and Download Annual Report. What similarities and differences do you see?arrow_forward
 Financial Accounting: The Impact on Decision Make...AccountingISBN:9781305654174Author:Gary A. Porter, Curtis L. NortonPublisher:Cengage Learning
 Principles of Accounting Volume 1AccountingISBN:9781947172685Author:OpenStaxPublisher:OpenStax College
 Managerial Accounting: The Cornerstone of Busines...AccountingISBN:9781337115773Author:Maryanne M. Mowen, Don R. Hansen, Dan L. HeitgerPublisher:Cengage Learning
 Financial And Managerial AccountingAccountingISBN:9781337902663Author:WARREN, Carl S.Publisher:Cengage Learning,