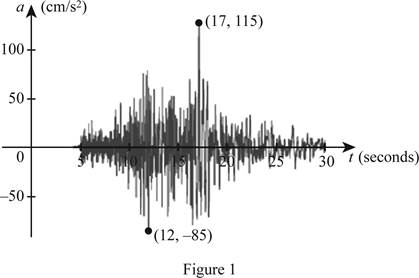
Figure 1 was recorded by an instrument operated by the California Department of Mines and Geology at the University Hospital of the University of Southern California in Los Angeles. Use it to estimate the range of the vertical ground acceleration function at USC during the Northridge earthquake.
To estimate: The range of the vertical ground acceleration functions at USC during the Northridge earthquake.
Answer to Problem 3E
The range of the vertical ground acceleration function is
Explanation of Solution
Given:
The graph which was recorded by an instrument operated by the California Department of Mines and Geology at the University Hospital of the University of Southern California in Los Angeles is shown below in Figure 1.

Estimation:
In Figure 1, the x-axis represents time in seconds and the y-axis represents the vertical ground acceleration during the Northridge earthquake in cm/s2.
It is observed from Figure 1 that the minimum point occurs at (12, −85) and the maximum point occurs at (17, 115).
Since, the range is the set of all y-values of the graph, the range of the vertical ground acceleration function is estimated to
Chapter 1 Solutions
Single Variable Calculus: Concepts and Contexts, Enhanced Edition
- 6. [-/1 Points] DETAILS MY NOTES SESSCALCET2 6.5.001. ASK YOUR TEACHER PRACTICE ANOTHER Let I = 4 f(x) dx, where f is the function whose graph is shown. = √ ² F(x 12 4 y f 1 2 (a) Use the graph to find L2, R2 and M2. 42 = R₂ = M₂ = 1 x 3 4arrow_forwardpractice problem please help!arrow_forwardFind a parameterization for a circle of radius 4 with center (-4,-6,-3) in a plane parallel to the yz plane. Write your parameterization so the y component includes a positive cosine.arrow_forward
- ~ exp(10). A 3. Claim number per policy is modelled by Poisson(A) with A sample x of N = 100 policies presents an average = 4 claims per policy. (i) Compute an a priory estimate of numbers of claims per policy. [2 Marks] (ii) Determine the posterior distribution of A. Give your argument. [5 Marks] (iii) Compute an a posteriori estimate of numbers of claims per policy. [3 Marks]arrow_forward2. The size of a claim is modelled by F(a, λ) with a fixed a a maximum likelihood estimate of A given a sample x with a sample mean x = 11 = 121. Give [5 Marks]arrow_forwardRobbie Bearing Word Problems Angles name: Jocelyn date: 1/18 8K 2. A Delta airplane and an SouthWest airplane take off from an airport at the same time. The bearing from the airport to the Delta plane is 23° and the bearing to the SouthWest plane is 152°. Two hours later the Delta plane is 1,103 miles from the airport and the SouthWest plane is 1,156 miles from the airport. What is the distance between the two planes? What is the bearing from the Delta plane to the SouthWest plane? What is the bearing to the Delta plane from the SouthWest plane? Delta y SW Angles ThreeFourthsMe MATH 2arrow_forward
 Calculus: Early TranscendentalsCalculusISBN:9781285741550Author:James StewartPublisher:Cengage Learning
 Thomas' Calculus (14th Edition)CalculusISBN:9780134438986Author:Joel R. Hass, Christopher E. Heil, Maurice D. WeirPublisher:PEARSON
 Calculus: Early Transcendentals (3rd Edition)CalculusISBN:9780134763644Author:William L. Briggs, Lyle Cochran, Bernard Gillett, Eric SchulzPublisher:PEARSON
 Calculus: Early TranscendentalsCalculusISBN:9781319050740Author:Jon Rogawski, Colin Adams, Robert FranzosaPublisher:W. H. Freeman
 Calculus: Early Transcendental FunctionsCalculusISBN:9781337552516Author:Ron Larson, Bruce H. EdwardsPublisher:Cengage Learning


