
Concept explainers
Videos
To sketch: The graph of the yield of a crop as a function of the amount of fertilizer used.
Explanation of Solution
Let the amount of fertilizer used be represented in the x-axis and the yield of a crop be represented in the y-axis.
If the amount of fertilizer used is less, then the yield of the crop will also be less in quantity.
Adding more fertilizer will increase the quantity of the crop and it remains constant by adding some more fertilizer.
If the amount of fertilizer is increased even more, then the yield will be decreased.
The rough graph of the yield of a crop as a function of the amount of fertilizer used is shown below in Figure 1.
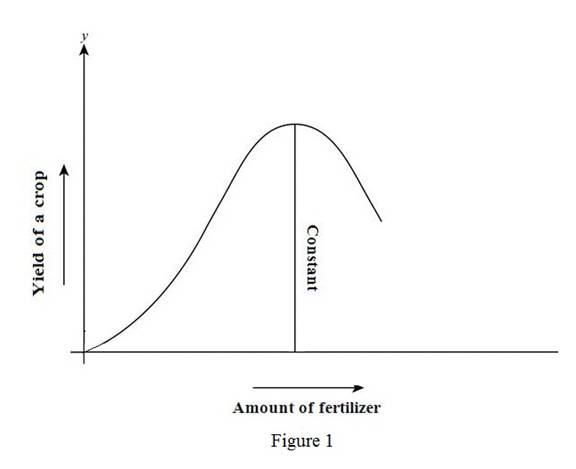
From Figure1, it is observed that the yield of the crop will remain constant for a certain amount of fertilizer.
Chapter 1 Solutions
Single Variable Calculus: Concepts and Contexts, Enhanced Edition


 Calculus: Early TranscendentalsCalculusISBN:9781285741550Author:James StewartPublisher:Cengage Learning
 Thomas' Calculus (14th Edition)CalculusISBN:9780134438986Author:Joel R. Hass, Christopher E. Heil, Maurice D. WeirPublisher:PEARSON
 Calculus: Early Transcendentals (3rd Edition)CalculusISBN:9780134763644Author:William L. Briggs, Lyle Cochran, Bernard Gillett, Eric SchulzPublisher:PEARSON
 Calculus: Early TranscendentalsCalculusISBN:9781319050740Author:Jon Rogawski, Colin Adams, Robert FranzosaPublisher:W. H. Freeman
 Calculus: Early Transcendental FunctionsCalculusISBN:9781337552516Author:Ron Larson, Bruce H. EdwardsPublisher:Cengage Learning