
Financial Reporting, Financial Statement Analysis and Valuation
8th Edition
ISBN: 9781285190907
Author: James M. Wahlen, Stephen P. Baginski, Mark Bradshaw
Publisher: Cengage Learning
expand_more
expand_more
format_list_bulleted
Concept explainers
Videos
Textbook Question
Chapter 11, Problem 10PC
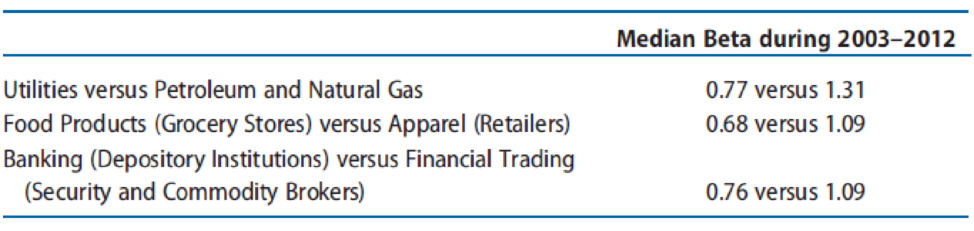
The data in Exhibit 11.3 on industry median betas suggest that firms in the following three sets of related industries have different degrees of systematic risk.
REQUIRED
- a. For each matched pair of industries, describe factors that characterize a typical firm’s business model in each industry. Describe how such factors would contribute to differences in systematic risk.
- b. For each matched pair of industries, use the
CAPM to compute the required rate ofreturn on equity capital for the median firm in each industry. Assume that the risk-free rate of return is 4.0% and the market risk premium is 5.0%. - c. For each matched pair of industries, compute the present value of a stream of $1 dividends for the median firm in each industry. Use the perpetuity-with-growth model and assume 3.0% long-run growth for each industry. What effect does the difference in systematic risk across industries have on the per-dollar dividend valuation of the median firm in each industry?
Expert Solution & Answer
Want to see the full answer?
Check out a sample textbook solution
Students have asked these similar questions
Analyst forecasts which focus on a top-down approach to forecasting future performance are most likely paying attention to:
A. Macroeconomic factors such as gross domestic product (GDP)
B. Signals from individual companies within an industry first
OC. Microeconomic factors such as dividend yields on bio-technology stocks (shares)
Using the data in the following table for a number of firms in the same industry, dothe following:•a. Compute the total asset turnover, the net profit margin, the equity multiplier, andthe return on equity for each firm.b. Evaluate each firm’s performance by comparing the firms with one another.Which firm or firms appear to be having problems? What corrective actionwould you suggest the poorer performing firms take? Finally, what additional data would you want to have on hand when conducting youranalyses?Firm
(in million Dollars
A
B
C
D
Sales
$20
$10
$15
$25
Net Income after sales
3
0.5
2.25
3
Total Assets
15
7.5
15
24
Stockholders’ Equity
10
5
14
10
Financial analysts have developed two performance measures: Market Value Added (MVA) and Economic Value Added (EVA). Discuss and explain both. Which is a better representative of the firm’s performance, and why?
Chapter 11 Solutions
Financial Reporting, Financial Statement Analysis and Valuation
Knowledge Booster


Learn more about
Need a deep-dive on the concept behind this application? Look no further. Learn more about this topic, finance and related others by exploring similar questions and additional content below.Similar questions
- Using the following data for Jackson Products Company, answer Parts a through g: Evaluate the liquidity position of Jackson relative to that of the average firm in theindustry. Consider the current ratio, the quick ratio, and the net working capital (currentassets minus current liabilities) for Jackson. What problems, if any, are suggested by thisanalysis?b) Evaluate Jackson’s performance by looking at key asset management ratios. Are anyproblem apparent from this analysis?c) Evaluate the financial risk of Jackson by examining its times interest earned ratio and itsequity multiplier ratio relative to the same industry average ratios.d) Evaluate the profitability of Jackson relative to that of the average firm in its industry,.e) Give an overall evaluation of the performance of Jackson relative to other firms in itsindustry.f) Perform a DuPont analysis for Jackson. What areas appear to have the greatest need forimprovement?g) Jackson’s current P/E ratio is 7 times. What factor(s) are…arrow_forwardMultiple Choice Questions 1. The following are the factors to be considered in Suitability, except A. Environment B. Capabilities C. Expectations D. Scenarios 2. The ____________ for a firm is the internal rate of return on existing investments, based on real cash flows. A. cash flow return on investment (CFROI) B. Economic Value Added (EVA) C. Total Shareholders Return D. Return on Investment 3. The elements that must be considered in using EVA are as follows, except ___________. A. Reasonableness of earnings B. Appropriate cost of Capital C. Volatility of the market D. None of the abovearrow_forwardWhich of the following is needed to calculate a firm’s WACC? A. the cost of carrying inventory B. the amount of capital necessary to make the investment C. the cost of preferred stock D. the probability distribution of expected returns E. both b and carrow_forward
- A trend analysis indicates a firm's performance ____. a.over time b.more accurately than any other type of analysis c.at one given point in time d.without relying on financial ratiosarrow_forwardA trend analysis indicates a firm's performance ____. a. at one given point in time b. over time c. without relying on financial ratios d. more accurately than any other type of analysisarrow_forwardWhen trying to estimate the cost of equity for a firm using the CAPM, it is possible to find the beta of a comparable, publicly traded firm whose primary business is closely related to the firm at hand. Select one: a. True b. Falsearrow_forward
- The relationship between WACC and investors' required rates of return The required rate of return of an investor is the rate of return that an investor demands to purchase a firm’s stocks or bonds and thus provide funds for capital investment. Therefore, required returns from the investors’ point of view correspond to the required returns or the weighted average cost of capital (WACC) from the firm’s point of view. Indicate in the following table whether each of the statements about WACC and the required rates of return of investors is true or false. Statement True False Flotation costs increase the cost of newly issued stock compared to the cost of the firm’s existing, or already outstanding, common stock or retained earnings. The firm’s cost of debt is what an investor is willing to pay for the firm’s stock before considering flotation costs. The amount that an investor is willing to pay for a firm’s bonds is inversely related to the…arrow_forwardWhich is true when evaluating two (2) companies operating in the same industry? Since they may have different betas, they should have the different risk-free rates. They should have the same beta. Regardless of capital structure, they should have the same risk-free rate in computing for cost of common equity. They should have the same cost of capitaarrow_forwardInvestors and financial analysts wanting to evaluate the operation efficiency of a firm's managers would probably look primarily at the firm's A. Leverage/debt ratios. market value ratios. 11. B. asset management ratios. D. liquidity ratios. C. 12. in a non-interest bearing account, this will tend to lower the firm's A. profit margin. B. return on equity. C. debt ratio. Other things held constant, if a firm holds cash balances in excess of their optimal level D. current ratio.arrow_forward
- A comparable firm (i.e., same industry and similar operations as our firm) has an equity beta of 1.3 and a debt-to - value ratio of 0.2. The debt of the comparable firm is risk - free. Based on the comparable firm, what is an appropriate asset beta for our firm? Give your answer to the closest 0.01.arrow_forwardPorter’s five-factor model provides a structure for analyzing the investment value of an industry or market/submarket, i.e., how profitable the average firm in the industry will be. Using this structure, assess whether each of the five factors is "good", "bad", or "uncertain" news for the retail banking industry (e.g., Wells Fargo, Fifth Third, etc.). Based on this analysis, what level of ROI would you expect firms in the industry to achieve, on average?arrow_forwardWhat is WACC (select all that are true)? Group of answer choices Rd (1-Tc) * D/V + Re * E/V Weighted Average Cost of Capital For a firm overall, it is based on the riskiness of the firm's assets While it is generally estimated by looking at the right-hand-side of the balance sheet, it is largely driven by the left-hand-side (i.e., assets) It is the amount that equity holders demand for an investment in a firm It is the amount that debt holders demand for a loan made to the firmarrow_forward
arrow_back_ios
SEE MORE QUESTIONS
arrow_forward_ios
Recommended textbooks for you
 Financial Reporting, Financial Statement Analysis...FinanceISBN:9781285190907Author:James M. Wahlen, Stephen P. Baginski, Mark BradshawPublisher:Cengage Learning
 EBK CONTEMPORARY FINANCIAL MANAGEMENTFinanceISBN:9781337514835Author:MOYERPublisher:CENGAGE LEARNING - CONSIGNMENT
 Cornerstones of Financial AccountingAccountingISBN:9781337690881Author:Jay Rich, Jeff JonesPublisher:Cengage Learning
Financial Reporting, Financial Statement Analysis...
Finance
ISBN:9781285190907
Author:James M. Wahlen, Stephen P. Baginski, Mark Bradshaw
Publisher:Cengage Learning
EBK CONTEMPORARY FINANCIAL MANAGEMENT
Finance
ISBN:9781337514835
Author:MOYER
Publisher:CENGAGE LEARNING - CONSIGNMENT
Cornerstones of Financial Accounting
Accounting
ISBN:9781337690881
Author:Jay Rich, Jeff Jones
Publisher:Cengage Learning
Portfolio return, variance, standard deviation; Author: MyFinanceTeacher;https://www.youtube.com/watch?v=RWT0kx36vZE;License: Standard YouTube License, CC-BY