
OPERATIONS MANAGEMENT IN THE SUPPLY CHAIN: DECISIONS & CASES (Mcgraw-hill Series Operations and Decision Sciences)
7th Edition
ISBN: 9780077835439
Author: Roger G Schroeder, M. Johnny Rungtusanatham, Susan Meyer Goldstein
Publisher: McGraw-Hill Education
expand_more
expand_more
format_list_bulleted
Concept explainers
Videos
Textbook Question
Chapter 10.S, Problem 5P
Management of the ABC Floral Shop believes that its sales are seasonal in nature with a monthly seasonal pattern and no trend. The demand data and seasonal ratios for the past three years are given as follows.
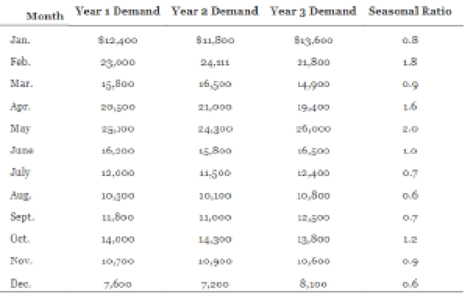
- a. Calculate a
forecast for Year 3 usingA0 = 15,000, α= γ = .3, and the seasonal ratios shown above. For each period, calculate the forecast and the updated seasonal ratio. - b. Plot the original data and the forecast on a graph.
- c. Calculate the tracking signals for the past year using MAD0 = o. Are they within tolerances?
- d. Using the classical decomposition method described in the chapter supplement, calculate the seasonal ratios from the data and determine the trend and average levels. Use these ratios and estimates of trend and level to make a forecast for the next year.
Expert Solution & Answer
Want to see the full answer?
Check out a sample textbook solution
Students have asked these similar questions
Here are the actual tabulated demands for an item for a nine-month period (January through September). Your supervisor wants to test two forecasting methods to see which method was better over this period.
MONTH
ACTUAL
January
120
February
145
March
146
April
171
May
154
June
182
July
138
August
135
September
146
a. Forecast April through September using a three-month moving average.
b. Use simple exponential smoothing with an alpha of 0.20 to estimate April through September, using the average of January through March as the initial forecast for April.
c-1. Calculate MAD for Three-month moving average and Exponential smoothing.
c-2. Use MAD to decide which method produced the better forecast over the six-month period.
Two independent methods of forecasting based on judgment and experience have been prepared each month for the past 10 months. The forecasts and actual sales are in the attached screenshot. Required: Compute the MAD and MSE for each forecast. Does either forecast seem superior? Explain.
4, The accompanying dataset provides the closing prices for four stocks and the stock exchange over 12 days. Complete parts a through c.
Complete the exponential smoothing forecast model for stock B.
(Type integers or decimals rounded to two decimal places as needed.)
Date
Forecast B
09/03/2010
09/07/2010
enter your response here
09/08/2010
enter your response here
09/09/2010
enter your response here
09/10/2010
enter your response here
09/13/2010
enter your response here
09/14/2010
enter your response here
09/15/2010
enter your response here
09/16/2010
enter your response here
09/17/2010
enter your response here
09/20/2010
enter your response here
09/21/2010
enter your response here
Date
A
B
C
D
Stock Exchange
09/03/2010
127.07
18.54
20.84
15.44
10,536.56
09/07/2010
124.84
18.21
20.45
15.55
10,245.77
09/08/2010
125.67
17.77
20.83
15.72…
Chapter 10 Solutions
OPERATIONS MANAGEMENT IN THE SUPPLY CHAIN: DECISIONS & CASES (Mcgraw-hill Series Operations and Decision Sciences)
Ch. 10.S - Ace Hardware sells spare parts for lawn mowers....Ch. 10.S - eXcel The daily demand for chocolate donuts from...Ch. 10.S - The SureGrip Tire Company produces tires of...Ch. 10.S - eXcelManagement believes there is a seasonal...Ch. 10.S - Management of the ABC Floral Shop believes that...Ch. 10 - Prob. 1DQCh. 10 - What is the distinction between forecasting and...Ch. 10 - Qualitative forecasting methods should be used...Ch. 10 - Describe the uses of qualitative, time-series, and...Ch. 10 - Qualitative forecasts and causal forecasts are not...
Ch. 10 - Prob. 6DQCh. 10 - What are the advantages of exponential smoothing...Ch. 10 - How should the choice of be made for exponential...Ch. 10 - Prob. 9DQCh. 10 - Prob. 10DQCh. 10 - Explain how CPFR can be used to reduce forecasting...Ch. 10 - Under what circumstances might CPFR be useful, and...Ch. 10 - Daily demand for marigold flowers at a large...Ch. 10 - The number of daily calls for the repair of Speedy...Ch. 10 - 3-The ABC Floral Shop sold the following number of...Ch. 10 - The Handy Dandy Department Store had forecast...Ch. 10 - 5-The Yummy Ice Cream Company uses the exponential...Ch. 10 - Using the data in problem 2, prepare exponentially...Ch. 10 - Compute the errors of bias and absolute deviation...Ch. 10 - eXcel At the ABC Floral Shop, an argument...Ch. 10 - Only a portion of the following table for...Ch. 10 - A candy store has sold the following number of...Ch. 10 - eXcel A grocery store sells the following number...Ch. 10 - Prob. 12PCh. 10 - The Easyfit tire store had demand for tires shown...Ch. 10 - Prob. 14P
Knowledge Booster


Learn more about
Need a deep-dive on the concept behind this application? Look no further. Learn more about this topic, operations-management and related others by exploring similar questions and additional content below.Similar questions
- Under what conditions might a firm use multiple forecasting methods?arrow_forwardThe file P13_42.xlsx contains monthly data on consumer revolving credit (in millions of dollars) through credit unions. a. Use these data to forecast consumer revolving credit through credit unions for the next 12 months. Do it in two ways. First, fit an exponential trend to the series. Second, use Holts method with optimized smoothing constants. b. Which of these two methods appears to provide the best forecasts? Answer by comparing their MAPE values.arrow_forwardThe Baker Company wants to develop a budget to predict how overhead costs vary with activity levels. Management is trying to decide whether direct labor hours (DLH) or units produced is the better measure of activity for the firm. Monthly data for the preceding 24 months appear in the file P13_40.xlsx. Use regression analysis to determine which measure, DLH or Units (or both), should be used for the budget. How would the regression equation be used to obtain the budget for the firms overhead costs?arrow_forward
- The file P13_22.xlsx contains total monthly U.S. retail sales data. While holding out the final six months of observations for validation purposes, use the method of moving averages with a carefully chosen span to forecast U.S. retail sales in the next year. Comment on the performance of your model. What makes this time series more challenging to forecast?arrow_forwardThe file P13_29.xlsx contains monthly time series data for total U.S. retail sales of building materials (which includes retail sales of building materials, hardware and garden supply stores, and mobile home dealers). a. Is seasonality present in these data? If so, characterize the seasonality pattern. b. Use Winters method to forecast this series with smoothing constants = = 0.1 and = 0.3. Does the forecast series seem to track the seasonal pattern well? What are your forecasts for the next 12 months?arrow_forwardThe file P13_02.xlsx contains five years of monthly data on sales (number of units sold) for a particular company. The company suspects that except for random noise, its sales are growing by a constant percentage each month and will continue to do so for at least the near future. a. Explain briefly whether the plot of the series visually supports the companys suspicion. b. By what percentage are sales increasing each month? c. What is the MAPE for the forecast model in part b? In words, what does it measure? Considering its magnitude, does the model seem to be doing a good job? d. In words, how does the model make forecasts for future months? Specifically, given the forecast value for the last month in the data set, what simple arithmetic could you use to obtain forecasts for the next few months?arrow_forward
- The file P13_26.xlsx contains the monthly number of airline tickets sold by the CareFree Travel Agency. a. Create a time series chart of the data. Based on what you see, which of the exponential smoothing models do you think will provide the best forecasting model? Why? b. Use simple exponential smoothing to forecast these data, using a smoothing constant of 0.1. c. Repeat part b, but search for the smoothing constant that makes RMSE as small as possible. Does it make much of an improvement over the model in part b?arrow_forwardThe owner of a restaurant in Bloomington, Indiana, has recorded sales data for the past 19 years. He has also recorded data on potentially relevant variables. The data are listed in the file P13_17.xlsx. a. Estimate a simple regression equation involving annual sales (the dependent variable) and the size of the population residing within 10 miles of the restaurant (the explanatory variable). Interpret R-square for this regression. b. Add another explanatory variableannual advertising expendituresto the regression equation in part a. Estimate and interpret this expanded equation. How does the R-square value for this multiple regression equation compare to that of the simple regression equation estimated in part a? Explain any difference between the two R-square values. How can you use the adjusted R-squares for a comparison of the two equations? c. Add one more explanatory variable to the multiple regression equation estimated in part b. In particular, estimate and interpret the coefficients of a multiple regression equation that includes the previous years advertising expenditure. How does the inclusion of this third explanatory variable affect the R-square, compared to the corresponding values for the equation of part b? Explain any changes in this value. What does the adjusted R-square for the new equation tell you?arrow_forwardThe file P13_28.xlsx contains monthly retail sales of U.S. liquor stores. a. Is seasonality present in these data? If so, characterize the seasonality pattern. b. Use Winters method to forecast this series with smoothing constants = = 0.1 and = 0.3. Does the forecast series seem to track the seasonal pattern well? What are your forecasts for the next 12 months?arrow_forward
- A small computer chip manufacturer wants to forecast monthly ozperating costs as a function of the number of units produced during a month. The company has collected the 16 months of data in the file P13_34.xlsx. a. Determine an equation that can be used to predict monthly production costs from units produced. Are there any outliers? b. How could the regression line obtained in part a be used to determine whether the company was efficient or inefficient during any particular month?arrow_forward5-37 Trevor Harty, an avid mountain biker, always wanted to start a business selling top-of-the-line mountain bikes and other outdoor supplies. A little over 6 years ago, he and a silent partner opened a store called Hale and Harty Trail Bikes and Supplies. Growth was rapid in the first 2 years, but since that time, growth in sales has slowed a bit, as expected. The quarterly sales (in $1,000s) for the past 4 years are shown in the table below: QUARTER YEAR 1 YEAR 2 YEAR 3 YEAR 4 1 274 282 282 296 2 172 178 182 210 3 130 136 134 158 4 162 168 170 182arrow_forwardThe monthly market shares of General Electric Company for 12 consecutive months follow. A. Construct a time series plot. What type of pattern exists in the data? B. Develop three-month and four-month moving averages for this time series. Does the three-month or the four-month moving average provide the better forecasts based on MSE? Explain your reasoning. C. Using your results in (B), compute MAD, MAPE, and Tracking Signal (TS). Which method provides better forecast? Explain your reasoning. Assume TS limit of ±4. D. Apply exponential smoothing to the data. Compute MSE, MAPE, MAD, and TS. Use a = 0.3. How does exponential smoothing compare with four-month moving average? Assume TS limit of ±4. Month 1 2 3 4 5 6 7 8 9 10 11 12 Market Shares 23.39 23.56 23.02 23.03 23.60 23.37 23.21 23.40 23.31 23.94 23.39 23.50arrow_forward
arrow_back_ios
SEE MORE QUESTIONS
arrow_forward_ios
Recommended textbooks for you
 Practical Management ScienceOperations ManagementISBN:9781337406659Author:WINSTON, Wayne L.Publisher:Cengage,
 Contemporary MarketingMarketingISBN:9780357033777Author:Louis E. Boone, David L. KurtzPublisher:Cengage Learning
 MarketingMarketingISBN:9780357033791Author:Pride, William MPublisher:South Western Educational Publishing
Practical Management Science
Operations Management
ISBN:9781337406659
Author:WINSTON, Wayne L.
Publisher:Cengage,
Contemporary Marketing
Marketing
ISBN:9780357033777
Author:Louis E. Boone, David L. Kurtz
Publisher:Cengage Learning
Marketing
Marketing
ISBN:9780357033791
Author:Pride, William M
Publisher:South Western Educational Publishing
Single Exponential Smoothing & Weighted Moving Average Time Series Forecasting; Author: Matt Macarty;https://www.youtube.com/watch?v=IjETktmL4Kg;License: Standard YouTube License, CC-BY
Introduction to Forecasting - with Examples; Author: Dr. Bharatendra Rai;https://www.youtube.com/watch?v=98K7AG32qv8;License: Standard Youtube License