
Videos
Tobacco Mosaic Virus. To assess the effects of two different strains of the tobacco mosaic virus, W. Youden and H. Beale randomly selected eight tobacco leaves. Half of each leaf was subjected to one of the strains of tobacco mosaic virus and the other half to the other strain. The researchers then counted the number of local lesions apparent on each half of each leaf. The results of their study were published in the paper “A Statistical Study of the Local Lesion Method for Estimating Tobacco Mosaic Virus” (Contributions Boyce Thompson Institute, Vol. 6, p. 437). Here are the data.
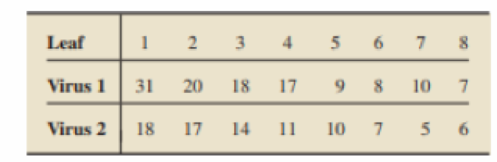
Suppose that you want to perform a hypothesis test to determine whether a difference exists between the mean numbers of local lesions resulting from the two viral strains. Conduct preliminary graphical analyses to decide whether applying the paired Wilcoxon signed-rank test is reasonable. Explain your decision.
Want to see the full answer?
Check out a sample textbook solution
Chapter 10 Solutions
Introductory Statistics (10th Edition)


- In this study, the protection of aquatic ecosystems is an important goal of Ville de Montréal. In particular, Thomas wants to see whether the contamination of creeks (ruisseaux in French) by Escherichia coli differs among the months of May, June, July, and August. Therefore, he randomly samples six creeks in different areas. For each creek, he collects water samples from May to August, and measures the amount of E. coli, expressed in colony forming units (CFU) per 100 mL of water. For each combination of a month and a creek, he thus obtains an E. coli contamination value, i.e., 24 observations in total. A preliminary statistical analysis produces the following results. 13-a) Does the mean E. coli contamination differ significantly among the four months? Justify your answer to this question with the result of a statistical test. Use α = 0.05. 13-b) Which pairs of months show significant differences in mean E. coli contamination? Explain your reasoning and justify your answer…arrow_forwardConsider the following studies. Study I: A researcher randomly divided 200 high school students into two groups. The first group was told to not exercise. The second group was told to exercise at least 5 hours each week. At the end of two months, the heart rates of each participant in each group were measured at rest. It was found that the group that exercised 5 hours a week had a significantly lower average heart rate. Study II: A researcher gathered 200 high school students randomly, asked them how long they exercised each week, and then measured their heart rates at rest. It was found that students who exercised at least 5 hours a week had a significantly lower average heart rate. Part A: Which study was experimental? Why? Study IStudy II Part B: List the explanatory and response variables in the studies. Explanatory: heart rate; Response: exercise timeExplanatory: student; Response: amount of exerciseExplanatory: exercise time; Response: heart rate Part C: State whether the…arrow_forward. A new drug for pain relief is being tested within a given palliative care population. The new drug is being compared to an already approved pain relief drug that is commonly used in providing palliative care to patients who experience chronic severe pain. Assume the patients are asked to rate the pain on a scale from 1 to 10, and the data presented below was obtained from a small study designed to compare the effectiveness of the two drugs. Set up and interpret the results of a Mann-Whitney Utest with an alpha of .05. Pain Rating as Reported by Patients Old Drug13346 New Drug12337 Old Drug New Drug Total Sample (Ordered Smallest to Largest) Ranks Old Drug New Drug Old Drug New Drug…arrow_forward
- The impact of a low-calorie diet on laboratory mice's longevity is being investigated by a medical researcher. Twenty mice are split into two groups (E and F) by random. A typical diet is given to Group E, while Group F is given a diet that only contains 70% as many calories as Group E's diet. The length of life (in days) of each mouse over the 36-month trial is documented. Table 2 provides the data that was obtained. The symbol of double star (**) signifies that the mouse was still alive at the end of the investigation. (a) (b) (c) Table 2: The length of life (in days) of each mouse Group E 900 907 751 833 920 787 830 877 848 901 Group F 1037 905 1023 988 1078 1011 ** 1063 898 1033 State a suitable null and alternative hypotheses for the problem. At 5% significance level, test the hypotheses in part (a) by using an appropriate nonparametric test. Write your conclusion.arrow_forwardThe authors of the paper "Statistical Methods for Assessing Agreement Between Two Methods of Clinical Measurement" compared two different instruments for measuring a subject's ability to breathe out air.† (This measurement is helpful in diagnosing various lung disorders.) The two instruments considered were a Wright peak flow meter and a mini-Wright peak flow meter. Seventeen subjects participated in the study, and for each subject air flow was measured once using the Wright meter and once using the mini-Wright meter. Subject 1 2 3 4 5 6 7 8 9 Mini- Wright Meter 512 430 520 428 500 600 364 380 658 Wright Meter + 494 395 516 434 476 557 413 442 650 Subject 10 11 12 13 14 15 16 17 Mini- Wright Meter 445 432 626 260 477 259 350 451 Wright Meter 433 417 656 267 478 178 423 427 (a) Suppose that the Wright meter is considered to provide a better measure of air flow, but the mini-Wright meter is easier to transport and to use. If the two types of meters produce different readings but there is…arrow_forwardThe authors of the paper "Statistical Methods for Assessing Agreement Between Two Methods of Clinical Measurement" compared two different instruments for measuring a subject's ability to breathe out air.† (This measurement is helpful in diagnosing various lung disorders.) The two instruments considered were a Wright peak flow meter and a mini-Wright peak flow meter. Seventeen subjects participated in the study, and for each subject air flow was measured once using the Wright meter and once using the mini-Wright meter. Subject Mini-WrightMeter WrightMeter Subject Mini-WrightMeter WrightMeter 1 512 494 10 445 433 2 430 395 11 432 417 3 520 516 12 626 656 4 428 434 13 260 267 5 500 476 14 477 478 6 600 557 15 259 178 7 364 413 16 350 423 8 380 442 17 451 427 9 658 650 (a) Suppose that the Wright meter is considered to provide a better measure of air flow, but the mini-Wright meter is easier to transport and to use. If the two types of meters produce…arrow_forward
- Makers of generic drugs are required to show that their generic drugs do not differ significantly from the “reference” or brand name drugs that they imitate. One aspect in which the generic drugs might differ is their extent of absorption in the blood. Twelve subjects were available for the study. Six were randomly selected to receive the generic drug first and then, after a washout period, receive the “reference” drug. The remaining six received the “reference” drug first, followed by the generic drug after the washout period. Assume that all conditions are met. The mean of the differences was 1.33 and the standard deviation of those differences was 2.90. What is the test statistic for this procedure? Group of answer choices 2.35 1.59 1.90 5.50arrow_forwarda. Imagine we are measuring the difference in blood sugar levels (mmol/L) in 25 sets of siblings, one of whom conducts regular physical exercise and the other who doesn't. We hypothesise that the energetic sibling will have lower blood sugar levels than the non-energetic sibling. What statistical test would be most appropriate for these data? Question 9 options: Independent samples t-test Paired t-test Single-sample t-test Mann-Whitney-Wilcoxon testarrow_forwardMakers of generic drugs are required to show that their generic drugs do not differ significantly from the “reference” or brand name drugs that they imitate. One aspect in which the generic drugs might differ is their extent of absorption in the blood. Twelve subjects were available for the study. Six were randomly selected to receive the generic drug first and then, after a washout period, receive the “reference” drug. The remaining six received the “reference” drug first, followed by the generic drug after the washout period. Suppose the actual p-value for a two-sided test is 0.140. On the basis of this p-value, what should you conclude at α = 0.05? Group of answer choices The mean difference between the absorption rate of the reference drug and the absorption rate of the generic drug is equal to zero There is insufficient evidence to conclude that the mean difference between the absorption rate of the reference drug and the absorption rate of the generic drug is not equal to…arrow_forward
- The National Highway Traffic Safety Administration requires each U.S. state to carry out an observational study to assess the level of seat belt use in the state. One report summarized data from a study done in a certain state. Unfortunately, the "sex" variable provided very little information, and only indicated that it collected the values Female and Male; it may be that this refers to the gender identity of the respondent. The proportions in the accompanying table are based on observations of over 25,000 drivers and passengers. Male Female Uses Seatbelt 0.422 0.452 Does Not Use Seat Belt 0.078 0.048 Assume that these proportions are representative of adults in this state and that an adult from this state is selected at random. (a) What is the probability that the selected adult uses a seat belt? (b) What is the probability that the selected adult uses a seat belt given that the individual selected is male?arrow_forward1. Birds can regrow feathers if they are lost. A researcher was interested in whether newly regrown feathers in the tails of northern flickers differed in colour (yellowness in particular) compared to older feathers. To test this, they measured the yellowness of one new and one randomly selected old feather on each of 20 birds. A plot of their data and the results of their analysis are shown below. Yellowness 160 150 140 130 new X Feather old Welch Two Sample t-test = data: Yellowness by Feather t = 1.5832, df 37.986, p-value 165 sample estimates: mean in group new mean in group old 147.9623 143.3000 160 New 155 150 145 140 135 = 0.1217 alternative hypothesis: true difference in means is not equal to 0 95 percent confidence interval: -1.299296 10.623962 T T T T T 130 135 140 145 150 155 160 Old a) From the results above, what is the null hypothesis and what statistical conclusion do you make concerning it?arrow_forwardA new drug for pain relief is being tested within a given palliative care population. The new drug is being compared to an already approved pain relief drug that is commonly used in providing palliative care to patients who experience chronic severe pain. Assume the patients are asked to rate the pain on a scale from 1 to 10, and the data presented below was obtained from a small study designed to compare the effectiveness of the two drugs. Set up and interpret the results of a Mann-Whitney U test with an alpha of .05. Pain Rating as Reported by Patients Old Drug 1 2 2 4 6 New Drug 1 2 2 3 7 Old Drug New Drug Total Sample (Ordered Smallest to Largest) Ranks Old Drug New Drug Old Drug New Drug 1 1 1 1 1.5 1.5 2 2 2 2 4.5 4.5 2 2 2 2 4.5 4.5 4 3 3 7 6 7 4 8 6…arrow_forward
 Glencoe Algebra 1, Student Edition, 9780079039897...AlgebraISBN:9780079039897Author:CarterPublisher:McGraw Hill