
MATLAB: An Introduction with Applications
6th Edition
ISBN: 9781119256830
Author: Amos Gilat
Publisher: John Wiley & Sons Inc
expand_more
expand_more
format_list_bulleted
Related questions
Question
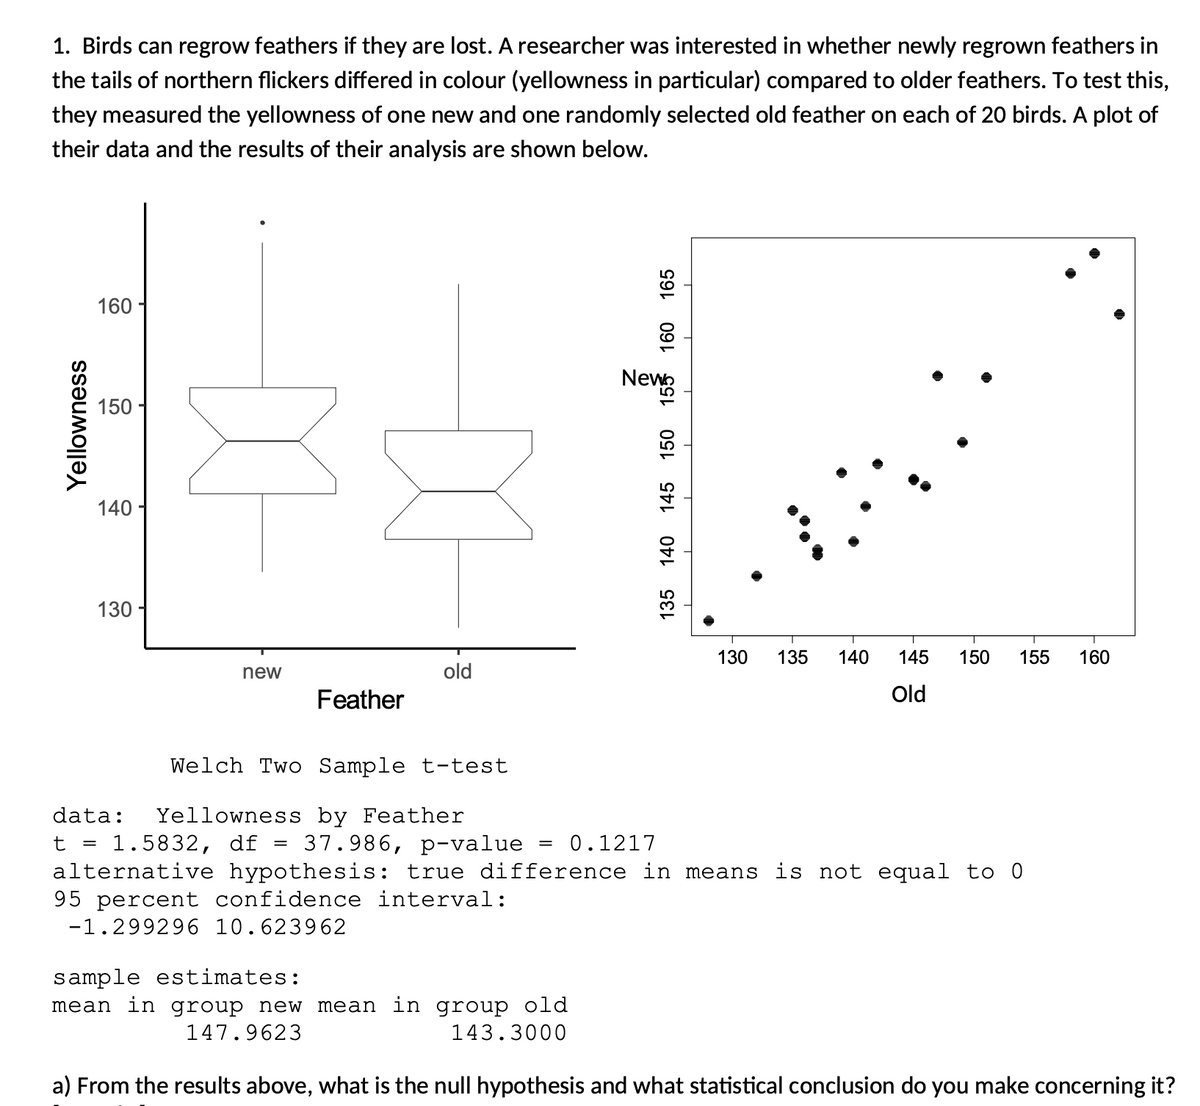

Transcribed Image Text:1. Birds can regrow feathers if they are lost. A researcher was interested in whether newly regrown feathers in
the tails of northern flickers differed in colour (yellowness in particular) compared to older feathers. To test this,
they measured the yellowness of one new and one randomly selected old feather on each of 20 birds. A plot of
their data and the results of their analysis are shown below.
Yellowness
160
150
140
130
new
X
Feather
old
Welch Two Sample t-test
=
data: Yellowness by Feather
t = 1.5832, df 37.986, p-value
165
sample estimates:
mean in group new mean in group old
147.9623
143.3000
160
New
155
150
145
140
135
= 0.1217
alternative hypothesis: true difference in means is not equal to 0
95 percent confidence interval:
-1.299296 10.623962
T
T
T
T
T
130 135 140 145 150 155 160
Old
a) From the results above, what is the null hypothesis and what statistical conclusion do you make concerning it?
Expert Solution
arrow_forward
Step 1: Overview
In this problem, we are interested in comparing the yellowness of old vs new feathers.
Null hypothesis: There is no difference between the average yellowness of old and new feathers in the tails of northern flickers.
Assuming 0.05 significance level.

Step by stepSolved in 3 steps

Knowledge Booster

Similar questions
- n a test of the effectiveness of garlic for lowering cholesterol, 42 subjects were treated with garlic in a processed tablet form. Cholesterol levels were measured before and after the treatment. The changes (before-after) in their levels of LDL cholesterol (in mg/dL) have a mean of 4.4 and a standard deviation of 18.6. Construct a 99% confidence interval estimate of the mean net change in LDL cholesterol after the garlic treatment. What does the confidence interval suggest about the effectiveness of garlic in reducing LDL cholesterol? Click here to view at distribution table. Click here to view page 1 of the standard normal distribution table. Click here to view page 2 of the standard normal distribution table. What is the confidence interval estimate of the population mean u? mg/dLarrow_forwardSales personnel for Skillings Distributors submit weekly reportslisting the customer contacts made during the week. A sample of 85 weekly reports showed a sample mean of 17.5 customer contacts perweek. The sample standard deviation was 5.6. Provide 90% and 95%confidence intervals for the population mean number of weeklycustomer contacts for the sales personnel.arrow_forwardIt is believed that the waiting time for a service has a population mean value of µ =13 minutes. One wants to test whether the population mean is 13 minutes. The waiting time of a sample of 60 services is collected. The significance level alpha is set at 5%. The Excel data analysis results are presented in table 2. Give appropriate null and alternative hypotheses. Null hypothesis H0: µ =13 minutes Alternative hypothesis H1: µ =/13 minutes Find the p value for this test. The p value: Click or tap here to enter text. What decision should be made about the hypotheses? Give evidence for your choice. Click or tap here to enter text. Table 2: One sample t-test results Variable Mean 14.72 Variance 34.38 Observations 60.00 Hypothesized Mean Difference 0.00 Df 59.00 t Stat 2.27 P(T<=t) one-tail 0.02 t Critical one-tail 1.67 P(T<=t) two-tail 0.04 t Critical two-tail 2.00arrow_forward
- Suppose you are interested in studying regional differences in crime rates. You take a random sample of 100 cities in the South, and find a mean crime rate of 55 with a sample variance of 5.78. A sample of 100 cities in the North has a mean crime rate of 50 with a sample variance of 6.72. Construct a 95% confidence interval around the difference in crime rates between the population of Southern cities and the population of Northern cities. Interpret, in words, the meaning of this interval.arrow_forwardState your conclusion for the ANOVA test and the reason(s) for your conclusion. Multiple Comparisons Dependent Variable: BMI Bonferroni (I) VAR00002 (J) VAR00002 Mean Difference (I-J) Std. Error Sig. 95% Confidence Interval Lower Bound Upper Bound 1.00 2.00 3.5432 1.8905 .217 -1.295 8.381 3.00 3.8582 1.7777 .118 -.691 8.407 2.00 1.00 -3.5432 1.8905 .217 -8.381 1.295 3.00 .3150 1.9299 1.000 -4.624 5.254 3.00 1.00 -3.8582 1.7777 .118 -8.407 .691 2.00 -.3150 1.9299 1.000 -5.254 4.624arrow_forwardMultiple choice questionsarrow_forward
- In a random sample of 2323 people, the mean commute time to work was 33.833.8 minutes and the standard deviation was 7.27.2 minutes. Assume the population is normally distributed and use a t-distribution to construct a 8080% confidence interval for the population mean muμ. What is the margin of error of muμ? Interpret the results. Question content area bottom Part 1 The confidence interval for the population mean muμ is left parenthesis nothing comma nothing right parenthesis .enter your response here,enter your response here. (Round to one decimal place as needed.) Part 2 The margin of error of muμ is enter your response here. (Round to one decimal place as needed.)arrow_forward10 K In a test of the effectiveness of garlic for lowering cholesterol, 50 subjects were treated with garlic in a processed tablet form. Cholesterol levels were measured before and after the treatment. The changes (before-after) in their levels of LDL cholesterol (in mg/dL) have a mean of 4.6 and a standard deviation of 16.6. Construct a 99% confidence interval estimate of the mean net change in LDL cholesterol after the garlic treatment Click here to view at distribution table. Click here to view page 1 of the standard normal distribution table. Click here to view page 2 of the standard normal distribution table. What is the confidence interval estimate of the population mean u? mg/dL <μarrow_forwardA study of 420,016 cell phone users found that 130 of them developed cancer of the brain or nervous system. Prior to this study of cell phone use, the rate of such cancer was found to be 0.0318% for those not using cell phones. Complete parts (a) and (b) a)use the sample data to construct a 95% confidence interval estimate of the percentage of cell phone users who develop cancer of the brain or nervous system. ____% < p < ____% b)do cell phone users appear to have a rate of cancer of the brain or nervous system that is different from the rate of such cancer among those not using cell phones. Why or why not? a) Yes, because 0.0318% is not included in the confidence interval b) Yes, because 0.0318% is included in the confidence interval c) No, because 0.0318% is not included in the confidence interval d) No, because 0.0318% is included in the confidence intervalarrow_forward
- A study was conducted to measure the effectiveness of hypnotism in reducing pain. The measurements are centimete on a pain scale before and after hypnosis. Assume that the paired sample data are simple random samples and that th differences have a distribution that is approximately normal. Construct a 95% confidence interval for the mean of the "before - after" differences. Does hypnotism appear to be effective in reducing pain? Before After 4.8 6.3 2.4 2.6arrow_forwardA sample of twenty newborn elephants had a sample mean of 225 pounds and a sample standard deviation of 15 pounds. However, it is known that the standard deviation for the population (sigma) is actually 18 pounds. Construct a 90% confidence interval for the weight of newborn elephants. Lower_______pounds Upper_______pounds Is it best to use a Z-interval or a T-interval?arrow_forwardun a test of the effectiveness of garlic for lowering cholesterol, 49 subjects were treated with garlic in a processed tablet form. Cholesterol levels were measured before and after the treatment. The changes (before - after) in their levels of LDL cholesterol (in mg/dL) have a mean of 2.8 and a standard deviation of 19.5. Construct a 99% confidence interval estimate of the mean net change in LDL cholesterol after the garlic treatment. What does the confidence interval suggest about the effectiveness of garlic in reducing LDL cholesterol? Click here to view a t distribution table. Click here to view page 1 of the standard normal distribution table. Click here to view page 2 of the standard normal distribution table. .... What is the confidence interval estimate of the population mean µ? mg/dL < µarrow_forward
arrow_back_ios
SEE MORE QUESTIONS
arrow_forward_ios
Recommended textbooks for you
- MATLAB: An Introduction with ApplicationsStatisticsISBN:9781119256830Author:Amos GilatPublisher:John Wiley & Sons Inc
 Probability and Statistics for Engineering and th...StatisticsISBN:9781305251809Author:Jay L. DevorePublisher:Cengage Learning
 Statistics for The Behavioral Sciences (MindTap C...StatisticsISBN:9781305504912Author:Frederick J Gravetter, Larry B. WallnauPublisher:Cengage Learning
  Elementary Statistics: Picturing the World (7th E...StatisticsISBN:9780134683416Author:Ron Larson, Betsy FarberPublisher:PEARSON
 The Basic Practice of StatisticsStatisticsISBN:9781319042578Author:David S. Moore, William I. Notz, Michael A. FlignerPublisher:W. H. Freeman
 Introduction to the Practice of StatisticsStatisticsISBN:9781319013387Author:David S. Moore, George P. McCabe, Bruce A. CraigPublisher:W. H. Freeman
MATLAB: An Introduction with Applications
Statistics
ISBN:9781119256830
Author:Amos Gilat
Publisher:John Wiley & Sons Inc
Probability and Statistics for Engineering and th...
Statistics
ISBN:9781305251809
Author:Jay L. Devore
Publisher:Cengage Learning
Statistics for The Behavioral Sciences (MindTap C...
Statistics
ISBN:9781305504912
Author:Frederick J Gravetter, Larry B. Wallnau
Publisher:Cengage Learning
Elementary Statistics: Picturing the World (7th E...
Statistics
ISBN:9780134683416
Author:Ron Larson, Betsy Farber
Publisher:PEARSON
The Basic Practice of Statistics
Statistics
ISBN:9781319042578
Author:David S. Moore, William I. Notz, Michael A. Fligner
Publisher:W. H. Freeman
Introduction to the Practice of Statistics
Statistics
ISBN:9781319013387
Author:David S. Moore, George P. McCabe, Bruce A. Craig
Publisher:W. H. Freeman