
Concept explainers
Videos
(a)
To find: the re-expression to create a suitable model.
(a)
Explanation of Solution
Given:
| Age | Years left |
| 10 | 60.3 |
| 20 | 50.7 |
| 30 | 41.8 |
| 40 | 32.9 |
| 50 | 24.8 |
| 60 | 17.9 |
| 70 | 12.1 |
| 80 | 7.9 |
| 90 | 5 |
| 100 | 3 |
Calculation:
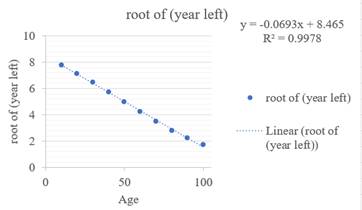
Re-expressing the data. Taking the root of year left
| Age | Years left | |
| 10 | 60.3 | 7.765307463 |
| 20 | 50.7 | 7.120393248 |
| 30 | 41.8 | 6.46529195 |
| 40 | 32.9 | 5.73585216 |
| 50 | 24.8 | 4.979959839 |
| 60 | 17.9 | 4.23083916 |
| 70 | 12.1 | 3.478505426 |
| 80 | 7.9 | 2.810693865 |
| 90 | 5 | 2.236067977 |
| 100 | 3 | 1.732050808 |
Graph:
Data analysis
Data > Data analysis > Regression
Step 1. Enter data in excel spreadsheet
Step 2. Click on Data > Data analysis > Regression.
Step 3. Select input Y and X
Step 4. Click Ok
This is the obtained output
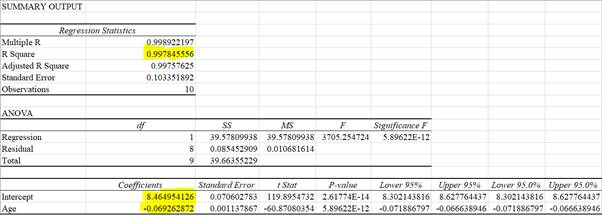
By seeing the scatter plot, it looks that there is strong linear data between age and root of year left. And the regression equation is
And the
R-squared value is 0.998 which represents that 99.8 percent of the variability in the root of number of year left is estimated for the model.
(b)
To Explain: the prediction of the lifespan of the 18-year-old black man.
(b)
Answer to Problem 29E
52.09
Explanation of Solution
Given:
Year = 18
Calculation:
(c)
To Explain: the satisfaction of the relation between years left and age.
(c)
Explanation of Solution
Given:
| Age | Years left |
| 10 | 60.3 |
| 20 | 50.7 |
| 30 | 41.8 |
| 40 | 32.9 |
| 50 | 24.8 |
| 60 | 17.9 |
| 70 | 12.1 |
| 80 | 7.9 |
| 90 | 5 |
| 100 | 3 |
Graph:
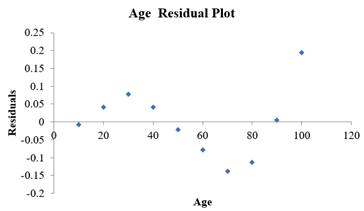
By seeing the residual plot, it represents the model is not fit the data well, therefore, this is not satisfying this model.
Chapter 10 Solutions
Stats: Modeling the World Nasta Edition Grades 9-12
Additional Math Textbook Solutions
Introductory Statistics
Introductory Statistics
Elementary Statistics: Picturing the World (7th Edition)
Elementary Statistics
Statistics for Business and Economics (13th Edition)


 MATLAB: An Introduction with ApplicationsStatisticsISBN:9781119256830Author:Amos GilatPublisher:John Wiley & Sons Inc
 Probability and Statistics for Engineering and th...StatisticsISBN:9781305251809Author:Jay L. DevorePublisher:Cengage Learning
 Statistics for The Behavioral Sciences (MindTap C...StatisticsISBN:9781305504912Author:Frederick J Gravetter, Larry B. WallnauPublisher:Cengage Learning
 Elementary Statistics: Picturing the World (7th E...StatisticsISBN:9780134683416Author:Ron Larson, Betsy FarberPublisher:PEARSON
 The Basic Practice of StatisticsStatisticsISBN:9781319042578Author:David S. Moore, William I. Notz, Michael A. FlignerPublisher:W. H. Freeman
 Introduction to the Practice of StatisticsStatisticsISBN:9781319013387Author:David S. Moore, George P. McCabe, Bruce A. CraigPublisher:W. H. Freeman