
Videos
(a)
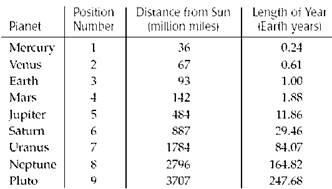
To construct: length of the year vs. the distancefrom the sun and explain the shape of the plot.
(a)
Explanation of Solution
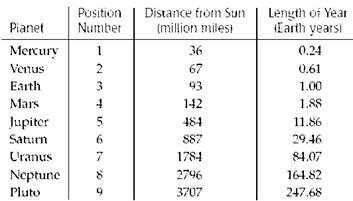
Given:
Graph:
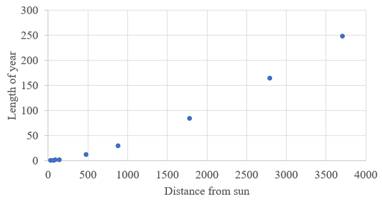
The scatter plot indicates a relationship that is moderate to powerful, positive and upward curved. The Planethave longer years away from the sun than closer planets.
(b)
To Explain: In order to straighten the plot and justify the duration of a planet's year depending on its distance from the sun, it re-expresses either or both variables.
(b)
Explanation of Solution
Given:

Calculation:
| Distance from sun | Length of year | Log(distance from sun) | log (length of year) |
| 36 | 0 | 1.5563 | -0.6198 |
| 67 | 1 | 1.8261 | -0.2147 |
| 93 | 1 | 1.9685 | 0.0000 |
| 142 | 2 | 2.1523 | 0.2742 |
| 484 | 12 | 2.6848 | 1.0741 |
| 887 | 29 | 2.9479 | 1.4692 |
| 1784 | 84 | 3.2514 | 1.9246 |
| 2796 | 165 | 3.4465 | 2.2170 |
| 3707 | 248 | 3.5690 | 2.3939 |
Graph:
Scatter Plot:
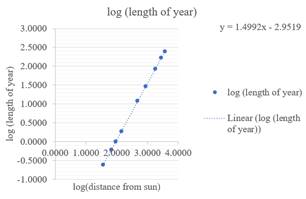
From the result of the regression line
(c)
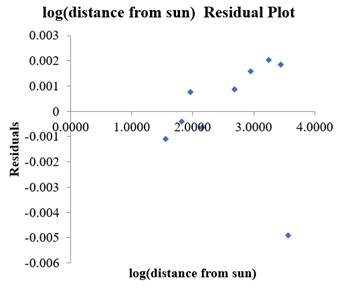
To Explain: the model for the fits the data.
(c)
Explanation of Solution
Given:
The model's R-squared is 100%, indicating that the model accounts for 100% variability in the log (length). No pattern displays the residual plot. So, it suits well with the linear model.
Chapter 10 Solutions
Stats: Modeling the World Nasta Edition Grades 9-12
Additional Math Textbook Solutions
Elementary Statistics
Intro Stats
Statistics for Business and Economics (13th Edition)
Elementary Statistics (13th Edition)
Introductory Statistics
Elementary Statistics: Picturing the World (7th Edition)


 MATLAB: An Introduction with ApplicationsStatisticsISBN:9781119256830Author:Amos GilatPublisher:John Wiley & Sons Inc
 Probability and Statistics for Engineering and th...StatisticsISBN:9781305251809Author:Jay L. DevorePublisher:Cengage Learning
 Statistics for The Behavioral Sciences (MindTap C...StatisticsISBN:9781305504912Author:Frederick J Gravetter, Larry B. WallnauPublisher:Cengage Learning
 Elementary Statistics: Picturing the World (7th E...StatisticsISBN:9780134683416Author:Ron Larson, Betsy FarberPublisher:PEARSON
 The Basic Practice of StatisticsStatisticsISBN:9781319042578Author:David S. Moore, William I. Notz, Michael A. FlignerPublisher:W. H. Freeman
 Introduction to the Practice of StatisticsStatisticsISBN:9781319013387Author:David S. Moore, George P. McCabe, Bruce A. CraigPublisher:W. H. Freeman