
Concept explainers
Videos
(a)
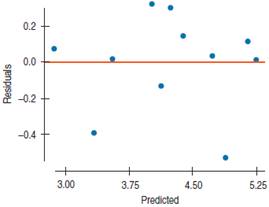
To Explain: the model appears to be better than the linear model.
(a)
Explanation of Solution
Given:

By observing the figure, that it is not displaying any pattern. That is the model fitted to data is more suitable. Therefore, this is a sign that this model looks to better than the linear model.
(b)
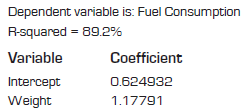
To write: an equation on this model using the
(b)
Explanation of Solution
Given:

The slope of the regression line equal to 1.17791 and intercept is equals to 0.624932. Therefore the equation of model is
(c)
To Explain: the slope of this line.
(c)
Explanation of Solution
Given:


There is slope is of 1.178. it implies that for each 1000 pounds in weights of car model expects that the fuel consumption of the car is increasing by 1.178 gal per 100 miles.
(d)
To find: the number of miles per gallon expects a 3500-pound car to get.
(d)
Answer to Problem 9E
21.06 miles/gal expected from a 3500 pound car.
Explanation of Solution
Given:


Calculation:
Estimated fuel consumption of 3500 pound is
Therefore, model expects that a 3500 pounds car weight needs 4.745 gal to drive 100 miles that is 0.04748 gal to drive one mile so
1/0.04748 miles/gal =21.06 miles/gal
So 21.06 miles/gal expected from a 3500 pound car.
Chapter 10 Solutions
Stats: Modeling the World Nasta Edition Grades 9-12
Additional Math Textbook Solutions
Essentials of Statistics (6th Edition)
Statistics for Psychology
Statistical Reasoning for Everyday Life (5th Edition)
Basic Business Statistics, Student Value Edition
Introductory Statistics (2nd Edition)
An Introduction to Mathematical Statistics and Its Applications (6th Edition)


 MATLAB: An Introduction with ApplicationsStatisticsISBN:9781119256830Author:Amos GilatPublisher:John Wiley & Sons Inc
 Probability and Statistics for Engineering and th...StatisticsISBN:9781305251809Author:Jay L. DevorePublisher:Cengage Learning
 Statistics for The Behavioral Sciences (MindTap C...StatisticsISBN:9781305504912Author:Frederick J Gravetter, Larry B. WallnauPublisher:Cengage Learning
 Elementary Statistics: Picturing the World (7th E...StatisticsISBN:9780134683416Author:Ron Larson, Betsy FarberPublisher:PEARSON
 The Basic Practice of StatisticsStatisticsISBN:9781319042578Author:David S. Moore, William I. Notz, Michael A. FlignerPublisher:W. H. Freeman
 Introduction to the Practice of StatisticsStatisticsISBN:9781319013387Author:David S. Moore, George P. McCabe, Bruce A. CraigPublisher:W. H. Freeman