
Concept explainers
Videos
(a)
To find: that the value of 97.2 percent suggests that this is a good model.
(a)
Explanation of Solution
Given:
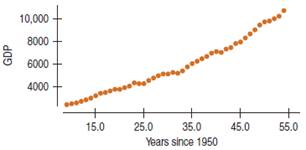
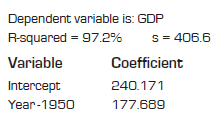
97.1 percent value of R-square is suggested that 97.1 percent of variability in GDP is accounted for by model. Without looking the residual figure, no one can say that this is good and fits to data well.
(b)
To Explain: that this is a good model for these data.
(b)
Explanation of Solution
Given:
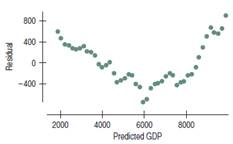
By seeing the scatter figure of residual display, it is a curved pattern. When the model fits the data would be well. Scatter figure of residual should not display any pattern. Therefore this is not a good model for this data.
Chapter 10 Solutions
Stats: Modeling the World Nasta Edition Grades 9-12
Additional Math Textbook Solutions
Elementary Statistics Using Excel (6th Edition)
Introductory Statistics
Statistical Reasoning for Everyday Life (5th Edition)
Intro Stats, Books a la Carte Edition (5th Edition)
Statistics: The Art and Science of Learning from Data (4th Edition)
Introductory Statistics (10th Edition)


 MATLAB: An Introduction with ApplicationsStatisticsISBN:9781119256830Author:Amos GilatPublisher:John Wiley & Sons Inc
 Probability and Statistics for Engineering and th...StatisticsISBN:9781305251809Author:Jay L. DevorePublisher:Cengage Learning
 Statistics for The Behavioral Sciences (MindTap C...StatisticsISBN:9781305504912Author:Frederick J Gravetter, Larry B. WallnauPublisher:Cengage Learning
 Elementary Statistics: Picturing the World (7th E...StatisticsISBN:9780134683416Author:Ron Larson, Betsy FarberPublisher:PEARSON
 The Basic Practice of StatisticsStatisticsISBN:9781319042578Author:David S. Moore, William I. Notz, Michael A. FlignerPublisher:W. H. Freeman
 Introduction to the Practice of StatisticsStatisticsISBN:9781319013387Author:David S. Moore, George P. McCabe, Bruce A. CraigPublisher:W. H. Freeman