
To ascertain:The necessity of general equilibrium analysis if there is an alteration in prices of goods by using mentioned diagram.
Answer to Problem 1RQ
Using the general equilibrium analysis will express more than the simple
Explanation of Solution
The rise in
The diagram is given below:
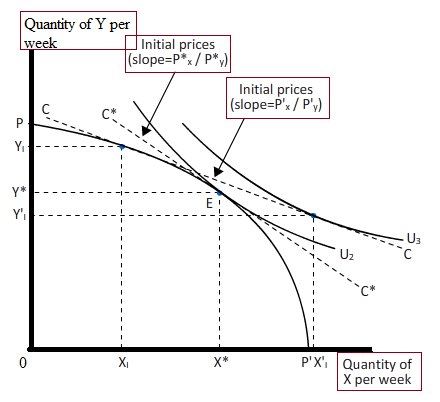
Excess demand has been shown by the difference between X’1, and X1. This excess demand willput upward pressure on the price of good X. If it would have been partial equilibrium analysis,this would have sufficed. However, in general, equilibrium analysis, along with excess demand forgood X, there will also be an
The excess supply is shown by thedifference between Y, and Y'1. This excess supply will put downward pressure on the price of goodY. The combined effect of this can be traced by clockwise rotation of the budget constraint. Thenew budget constraint C*C* is steeper than the old budget constraint CC. The steepness ofthe budget constraint C*C* indicates that price of good X has increased and price of good Yhas fallen.Hence, the new equilibrium is designated by point E which is arrived at by the interaction ofthe purchasers and the suppliers in the general equilibrium set up.
The new equilibrium, E, is theefficiency point where society's welfare is increased if
But, in an integrated market set upwhich reflects more real world this will not suffice. The necessity is to apply general equilibriumanalysis to check changes in demand tocalculate efficient outcomes that increasethe welfare of society.
Introduction: General equilibrium analysis is referring to the equilibrium of complete organisation in the economy purchaser, manufacture, resource owner, services and industries.General equilibrium succeeds when both good and factor markets are in equilibrium in relation to each other.
Want to see more full solutions like this?
Chapter 10 Solutions
EBK INTERMEDIATE MICROECONOMICS AND ITS

- What is an equilibrium condition? How do we that we have an equilibrium condition?arrow_forwardThe following graph shows the market for cereal in Philadelphia, where there are over 1,000 stores that sell cereal at any given moment. Suppose the price of breakfast bars decreases. (Assume that people regard cereal and breakfast bars as substitutes.) Show the effect of this change on the market for cereal by shifting one or both of the curves on the following graph, holding all else constant. Note: Select and drag one or both of the curves to the desired position. Curves will snap into position, so if you try to move a curve and it snaps back to its original position, just drag it a little farther.arrow_forwardSuppose that the demand and supply of liter of petrol are given in table 1 as per attachment What is the equilibrium price and quantity of petrol? Use a graph paper to draw a demand curve and supply curve based on the table above. Now suppose that a political crisis in the Middle East lead to a decrease in the supply of petrol by 8 liter per day at every price. Show the change in the graph paper and show the new equilibrium position. What is the new equilibrium price of petrol? What is the new equilibrium quantity of petrol? In order t o help the consumer, the government imposes a price control of RM0.60 per liter: Give the name of this price control. How much petrol will be demanded by consumer at this price?. How much petrol will be offered for sale by…arrow_forward
- Graphically illustrate and explain the following conditions of equilibrium condition. Also, explain what would happen on equilibrium price and quantity. 1 increase in demand is an equal decrease in price 2 decrease in demand is greater than the increase in supply 3 increase in demand is less than the increase in supply 4 decrease in supply is greater than the decrease in supply 5 increase in demand is greater than the increase in supplyarrow_forwardAssume that you are told that because of some changes, the equilibrium price increased but it is unknown if the equilibrium quantity increased, remained the same, or decreased. Which of the following would be consistent with this outcome?a. There was a decrease in input costs and consumers expected lower income.b. Consumers expected a lower price and firms expected a higher price.c. There was a decrease in income (the good is inferior) and a decrease in the number of firms.d. There was a positive change in consumer tastes and an increase in productivity. When demand is _______ consumers are _______ to price changes and the price elasticity of demand is _______.a. elastic, relatively sensitive, greater than one (in absolute value)b. inelastic, completely insensitive, equal to one (in absolute value)c. inelastic, relatively sensitive, less than one (in absolute value)d. unit elastic, hyper-sensitive, equal to zeroe. perfectly elastic, hyper-sensitive, equal to one (in absolute value)…arrow_forwardcan you answer these questions too: Suppose that more consumers prefer the disposable cell phone over the smart phone because the disposable cell phone is more durable than the smart phone. This latest news comes after the fact that firms that manufacture disposable cell phones have the latest technology integrated into their production facilities. What will be the market effect? Going back to question (d), suppose that the price of a disposable cell phone is now set at $11.75. How many disposable cell phones will be demanded by consumers? Whichever curve you’ve determined should be shifted, derive the new function.arrow_forward
- Use the following table to answer the question below. Quantity Demanded Price Quantity Supplied 5 $7 9 6 6 8 7 5 7 8 4 6 9 3 5 10 2 4 11 1 3 If demand decreased by 4 units at each price, what would the new equilibrium price and quantity be? Multiple Choice $3 and 5 units $4 and 6 units $5 and 7 units $6 and 8 units Assume that the graphs show a competitive market for the product stated in the question. In graph 1, an increasing line, S intersects two decreasing lines, D1 and D2 at points E1 and E2, respectively. A positive shift from D1 to D2 (to the right) is shown with an increase in price from P1 to P2 and increase in quantity from q1 to q2. In graph 2, an increasing line, S intersects two decreasing lines, D1 and D2 at points E1 and E2, respectively. A negative shift from D1 to D2 (to the left) is shown with a decrease in price from P1 to P2 and decease in quantity from q1 to q2. In graph 3, two increasing lines, S1…arrow_forwardWhat is equilibriumarrow_forwardRefer to the table above. If demand increased by 4 units at each price , what would the new equilibrium price and quantity be?arrow_forward
- In the aftermath of the devastating hurricane Sandy in the Northeast and Jersey Shore, prices of certain goods had risen dramatically. Some people had objected to these price increases, and called for the government to forbid sellers from charging such high prices. This exercise asks you to apply economic principles in explaining why prices tend to rise, and what consequences would result from forbidding sellers from raising prices. We will consider the case of bottled fresh water being available for sale in supermarkets. Draw a graph showing the equilibrium price for the pre-hurricane demand for and supply of bottled water that currently existed in the market place. (label the current equilibrium price as p1 on the price axis, and the quantity as q1 on the quantity axisarrow_forwardWrite the goods market equilibrium conditions/equations and draw the graph of market equilibrium.arrow_forwardIn the graph above, suppose equilibrium is at point D. The price of the good is expected to rise in the future, then equilibrium will A. shift to point A. B. shift to point B. C. shift to point C. D. remain at point D.arrow_forward


 Economics (MindTap Course List)EconomicsISBN:9781337617383Author:Roger A. ArnoldPublisher:Cengage Learning
 Exploring EconomicsEconomicsISBN:9781544336329Author:Robert L. SextonPublisher:SAGE Publications, Inc