Concept explainers
PROBLEM 1—18 Direct and Indirect Costs; Variable Costs
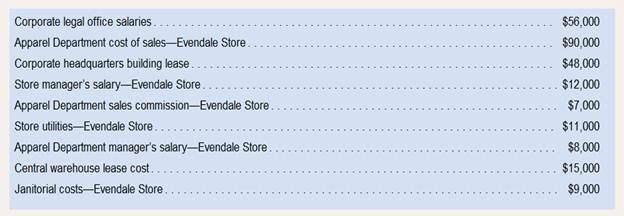
The following cost data pertain to the operations of Montgomery Department Stores, Inc., for the month of July. 
The Evendale Store is one of many stores owned and operated by the company. The Apparel Department is one of many departments at the Evendale Store. The central warehouse serves all of the company’s stores.
Required:
1.What is the total amount of the costs listed above that are direct costs of the Apparel Department?
2. What is the total amount of the costs listed above that are direct costs of the Evendale Store?
3. What is the total amount of the Apparel Department’s direct costs that are also variable costs with respect to total departmental sales?
Want to see the full answer?
Check out a sample textbook solution
Chapter 1 Solutions
Introduction To Managerial Accounting
- Allocating selling and administrative expenses using activity-based costing Shrute Inc. manufactures office copiers, which are sold to retailers. The price and cost of goods sold for each copier are as follows: In addition, the company incurs selling and administrative expenses of 414,030. The company wishes to assign these costs to its three major retail customers, The Warehouse, Kosmo Co., and Supply Universe. These expenses are related to its three major nonmanufacturing activities: customer service, sales order processing, and advertising support. The advertising support is in the form of advertisements that are placed by Shrute Inc. to support the retailers sale of Shrute copiers to consumers. The budgeted activity costs and activity bases associated with these activities are: Activity-base usage and unit volume information for the three customers is as follows: Instructions Determine the activity rates for each of the three nonmanufacturing activities. Determine the activity costs allocated to the three customers, using the activity rates in (1). Construct customer profitability reports for the three customers, dated for the year ended December 31, using the activity costs in (2). The reports should disclose the gross profit and operating income associated with each customer. Provide recommendations to management, based on the profitability reports in (3).arrow_forward(Appendix 3A) Method of Least Squares Using Computer Spreadsheet Program The controller for Beckham Company believes that the number of direct labor hours is associated with overhead cost. He collected the following data on the number of direct labor hours and associated factory overhead cost for the months of January through August. Required: 1. Using a computer spreadsheet program such as Excel, run a regression on these data. Print out your results. 2. Using your results from Requirement 1, write the cost formula for overhead cost. (Note: Round the fixed cost to the nearest dollar and the variable rate to the nearest cent.) 3. CONCEPTUAL CONNECTION What is R2 based on your results? Do you think that the number of direct labor hours is a good predictor of factory overhead cost? 4. Assuming that expected September direct labor hours are 700, what is expected factory overhead cost using the cost formula in Requirement 2?arrow_forwardUse the following information for Brief Exercises 4-27 and 4-28: Quillen Company manufactures a product in a factory that has two producing departments, Cutting and Sewing, and two support departments, S1 and S2. The activity driver for S1 is number of employees, and the activity driver for S2 is number of maintenance hours. The following data pertain to Quillen: Brief Exercises 4-27 (Appendix 4B) Assigning Support Department Costs by Using the Direct Method Refer to the information for Quillen Company above. Required: 1. Calculate the cost assignment ratios to be used under the direct method for Departments S1 and S2. (Note: Each support department will have two ratiosone for Cutting and the other for Sewing.) 2. Allocate the support department costs to the producing departments by using the direct method.arrow_forward
- (Appendix 3A) Separating Fixed and Variable Costs, Service Setting Louise McDermott, controller for the Galvin plant of Veromar Inc., wanted to determine the cost behavior of moving materials throughout the plant. She accumulated the following data on the number of moves (from 100 to 800 in increments of 100) and the total cost of moving materials at those levels of moves: Required: 1. Prepare a scattergraph based on these data. Use cost for the vertical axis and number of moves for the horizontal axis. Based on an examination of the scattergraph, does there appear to be a linear relationship between the total cost of moving materials and the number of moves? 2. Compute the cost formula for moving materials by using the high-low method. Calculate the predicted cost for a month with 550 moves by using the high-low formula. (Note: Round the answer for the variable rate to three decimal places and the answer for total fixed cost and total cost to the nearest dollar.) 3. CONCEPTUAL CONNECTION Compute the cost formula for moving materials using the method of least squares. (Note: For the method of least squares, round the variable rate to two decimal places and total fixed cost and total cost to the nearest dollar.) Using the regression cost formula, what is the predicted cost for a month with 550 moves? What does the coefficient of determination tell you about the cost formula computed by regression? 4. CONCEPTUAL CONNECTION Evaluate the cost formula using the least squares coefficients. Could it be improved? Try dropping the third data point (300, 3,400), and rerun the regression.arrow_forwardBrief Exercise 3-32 Absorption-Costing Income Statement Refer to the data for Beyta Company above. Required: 1. Calculate the cost of goods sold under absorption costing. 2. Prepare an income statement using absorption costing. Use the following information for Brief Exercises 3-32 and 3-33: During the most recent year, Beyta Company had the following data:arrow_forwardCommunication The controller of New Wave Sounds Inc. prepared the following product profitability report for management, using activity-based costing methods for allocating both the factory overhead and the marketing expenses. As such, the controller has confidence in the accuracy of this report. Home Theater Speakers Wireless Speakers Wireless Headphones Total Sales 1,500,000 1,200,000 900,000 3,600,000 Cost of goods sold 1,050,000 720,000 810,000 2,580,000 Gross profit 450,000 480,000 90,000 1,020,000 Marketing expenses 600,000 120,000 72,000 792,000 Income from operations (150,000) 360,000 18,000 228,000 In addition, the controller interviewed the vice president of marketing, who provided the following insight into the company's three products: The home theater speakers are an older product that is highly recognized in the marketplace. The wireless speakers are a new product that was just recently bunched. The wireless headphones are a new technology that has no competition in the marketplace, and it is hoped that they will become an important future addition to the companys product portfolio. Initial indications are that the product is well received by customers. The controller believes that the manufacturing costs for all three products are in line with expectations. Based on the information provided: 1. Calculate the ratio of gross profit to sales and the ratio of income from operations to sales for each product. 2. Write a brief (one page) memo using the product profitability report and the calculations in (1) to make recommendations to management with respect to strategies for the three products.arrow_forward
- Hart Manufacturing makes three products. Each product requires manufacturing operations in three departments: A, B, and C. The labor-hour requirements, by department, are as follows: During the next production period the labor-hours available are 450 in department A, 350 in department B, and 50 in department C. The profit contributions per unit are 25 for product 1, 28 for product 2, and 30 for product 3. a. Formulate a linear programming model for maximizing total profit contribution. b. Solve the linear program formulated in part (a). How much of each product should be produced, and what is the projected total profit contribution? c. After evaluating the solution obtained in part (b), one of the production supervisors noted that production setup costs had not been taken into account. She noted that setup costs are 400 for product 1, 550 for product 2, and 600 for product 3. If the solution developed in part (b) is to be used, what is the total profit contribution after taking into account the setup costs? d. Management realized that the optimal product mix, taking setup costs into account, might be different from the one recommended in part (b). Formulate a mixed-integer linear program that takes setup costs provided in part (c) into account. Management also stated that we should not consider making more than 175 units of product 1, 150 units of product 2, or 140 units of product 3. e. Solve the mixed-integer linear program formulated in part (d). How much of each product should be produced and what is the projected total profit contribution? Compare this profit contribution to that obtained in part (c).arrow_forwardClassifying Costs The following is a list of costs incurred by several manufacturing companies. Classify each of the following costs as product cost or period cost. Indicate whether each product cost is a direct materials cost, a direct labor cost, or a factory overhead cost. Indicate whether each period cost is a selling expense or an administrative expense. Costs Classification a. Bonus for vice president of marketing b. Costs of operating a research laboratory c. Cost of unprocessed milk for a dairy d. Depreciation of factory equipment e. Entertainment expenses for sales representatives f. Factory supplies g. First-aid nurse for factory workers h. Health insurance premiums paid for factory workers i. Hourly wages of warehouse laborers j. Lumber used by furniture manufacturer k. Maintenance costs for factory equipment l. Microprocessors for a microcomputer manufacturer m. Packing supplies for products sold, which are…arrow_forwardLO 9.4Assume you are the department B manager for Marley’s Manufacturing. Marley’s operates under a cost-based transfer structure. Assume you receive the majority of your raw materials from department A, which sells only to department B (they have no outside sales). After calculating the operating income in dollars and operating income in percentage, analyze the following financial information to determine costs that may need further investigationarrow_forward
- 7arrow_forwardHi expart Provide answer the general accounting question not use Aiarrow_forwardE4-14 Venus Creations sells window treatments (shades, blinds, and awnings) to both commercial and residential customers. The following information relates to its budgeted operations for the current year. $300,000 Direct materials costs Direct labor costs 150,000 Setup time 500,000 Supervision $ 30,000 100,000 Commercial Operating income (loss) $480,000 Overhead costs Revenues $85,000 85,000 Estimated Overhead 90,000 60,000 $85,000 The controller, Peggy Kingman, is concerned about the residential product line. She cannot understand why this line is not more profitable given that the installations of window coverings are less complex for residential customers. In addition, the residential client base resides in close proximity to the company office, so travel costs are not as expensive on a per client visit for residential customers. As a result, she has decided to take a closer look at the overhead costs assigned to the two product lines to determine whether a more accurate product…arrow_forward
 Managerial Accounting: The Cornerstone of Busines...AccountingISBN:9781337115773Author:Maryanne M. Mowen, Don R. Hansen, Dan L. HeitgerPublisher:Cengage Learning
 Managerial AccountingAccountingISBN:9781337912020Author:Carl Warren, Ph.d. Cma William B. TaylerPublisher:South-Western College Pub
 Financial & Managerial AccountingAccountingISBN:9781285866307Author:Carl Warren, James M. Reeve, Jonathan DuchacPublisher:Cengage Learning
 Essentials of Business Analytics (MindTap Course ...StatisticsISBN:9781305627734Author:Jeffrey D. Camm, James J. Cochran, Michael J. Fry, Jeffrey W. Ohlmann, David R. AndersonPublisher:Cengage Learning
 Financial & Managerial AccountingAccountingISBN:9781337119207Author:Carl Warren, James M. Reeve, Jonathan DuchacPublisher:Cengage Learning


