
Biology (MindTap Course List)
11th Edition
ISBN: 9781337392938
Author: Eldra Solomon, Charles Martin, Diana W. Martin, Linda R. Berg
Publisher: Cengage Learning
expand_more
expand_more
format_list_bulleted
Concept explainers
Videos
Textbook Question
Chapter 1, Problem 14TYU
INTERPRET DATA Compare the two graphs in Figure 1-17. What information does the second graph illustrate? What possible explanation can you give for the differences shown in the two graphs?
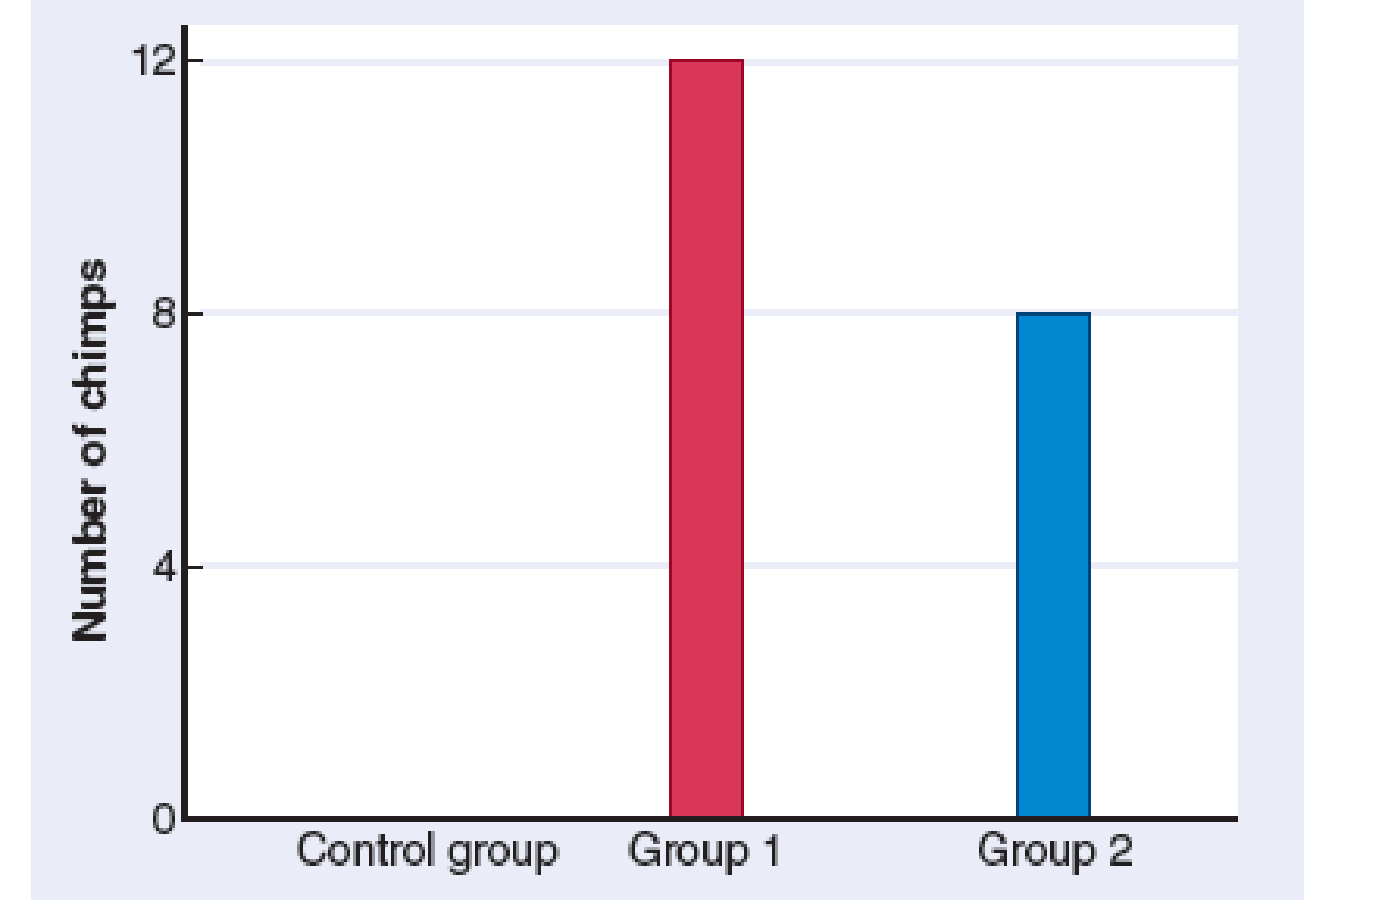
(a) Number of chimpanzees who successfully employed specific method of tool use.
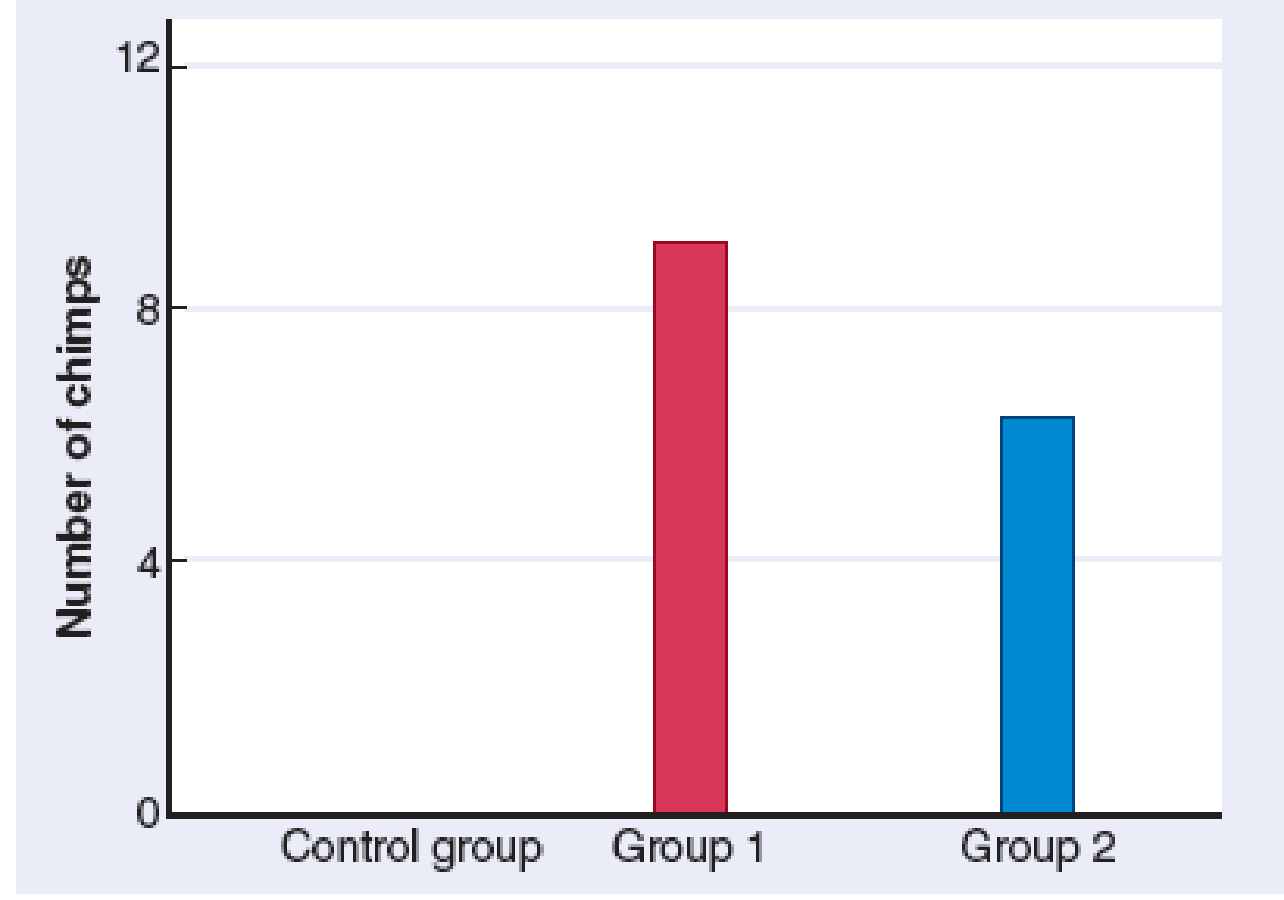
(b) Number of chimpanzees who successfully employed learned method of tool use two months later.
Figure 1-17 An experiment testing learning in chimpanzee populations In the photo, wild chimpanzees are shown observing a member of their group using a tool.
Expert Solution & Answer

Trending nowThis is a popular solution!

Students have asked these similar questions
Give only typing answer with explanation and conclusion
Researchers were measuring the % change in range sizes of 42 mammal species over a 50 year period. The values ranged from -14.6% (indicating a decrease of 14.6% in the range size) to +32.1% (indicating an increase of 32.1% in the range size). On average, the mean % change across all the species was +6.3%. To test whether this result differed from the null hypothesis expectation that the mean change would be 0% what test should the researchers use?
a) independent sample t-test
b) paired t-test
c) non-parametric test
d) single sample t-test
Chimpanzees have been observed making and using tools in the wild.
True or false?
Explore the research narrative of two evolutionary biologists who investigated the evolution of Galapagos finches over multiple decades here: https://www.biointeractive.org/classroom-resources/interactive-assessment-beak-finch
Answer the assessment questions at the end of the video
Chapter 1 Solutions
Biology (MindTap Course List)
Ch. 1.1 - Describe five basic themes of biology.Ch. 1.1 - Why are information transmission, energy transfer,...Ch. 1.1 - CONNECT What are some ways in which an organism is...Ch. 1.2 - Prob. 2LOCh. 1.2 - Prob. 1CCh. 1.2 - Predict What would be the consequences to an...Ch. 1.3 - Prob. 3LOCh. 1.3 - What are the levels of organization within an...Ch. 1.3 - PREDICT At which level do you think more...Ch. 1.4 - Summarize the importance of information transfer...
Ch. 1.4 - What is the function of DNA?Ch. 1.4 - How does a nervous system transmit information?Ch. 1.5 - Summarize the flow of energy through ecosystems...Ch. 1.5 - Predict What components do you think a forest...Ch. 1.5 - Connect In what ways do consumers depend on...Ch. 1.6 - Demonstrate the binomial system of nomenclature by...Ch. 1.6 - Prob. 7LOCh. 1.6 - Prob. 8LOCh. 1.6 - Prob. 9LOCh. 1.6 - The scientific name for the African rock python is...Ch. 1.6 - Prob. 2CCh. 1.6 - How might you explain the sharp claws and teeth of...Ch. 1.7 - Design a study to test a given hypothesis, using...Ch. 1.7 - Compare the reductionist and systems approaches to...Ch. 1.7 - What are the characteristics of a good hypothesis?Ch. 1.7 - Prob. 2CCh. 1.7 - CONNECT In what ways does systems biology depend...Ch. 1 - Prob. 1TYUCh. 1 - Prob. 2TYUCh. 1 - Prob. 3TYUCh. 1 - Fungi are assigned to domain (a) Protista (b)...Ch. 1 - The scientific name for corn is Zea mays. Zea is...Ch. 1 - Darwin suggested that evolution takes place by (a)...Ch. 1 - Ideally, an experimental group differs from a...Ch. 1 - Prob. 8TYUCh. 1 - VISUALIZE Draw a simple cladogram illustrating the...Ch. 1 - predict What would happen if a homeostatic...Ch. 1 - What are some characteristics of a good...Ch. 1 - PREDICT Make a prediction and devise a suitably...Ch. 1 - Prob. 13TYUCh. 1 - INTERPRET DATA Compare the two graphs in Figure...Ch. 1 - Evolution Link In what ways does evolution depend...Ch. 1 - EVOLUTION LINK How might an understanding of...Ch. 1 - SCIENCE, TECHNOLOGY, AND SOCIETY In the future,...
Knowledge Booster


Learn more about
Need a deep-dive on the concept behind this application? Look no further. Learn more about this topic, biology and related others by exploring similar questions and additional content below.Similar questions
- You want to distinguish between two hypotheses to explain the patterns you see: 1) Males not feeding the young is an adaptation to dimorphism 2) If males don't feed the young in a species, it will allow them to become brightly colored To begin to address this question, map the characters changes in dimorphism and males feeding the young onto each of the trees on the previous page. CHARACTER SEXUAL DIMORPHISM MALES FEED YOUNG Cassin's Vireo No No Red Fox Sparrow Cape May Warbler Cedar Waxwing Golden-Crowned Kinglet Pyrrhuloxia Yes No No No No Yes No Yes Yes No California Gull No Yes Note: This data is fictional 5) Which of the hypotheses in part 4 is consistent with your analysis? Explain why in a brief paragraph.arrow_forwardUse Verbal description of results from graph and then Interpret the graph for Speacialization scenario in foraging lab. The interpretations must include: Were the results expected and Did they support the hypotheses? If so, state the biological significance of the results from graph. If the results deviated significantly from expected results, discuss the hypotheses onthe basis of expected results and include an explanation of why this might be so. Lastly, state the conclusions drawn from the experiment and their biological relevance. Hypothesis: Within the context of specialization, foragers will exhibit differences in foraging efficiency between pure and mixed food types, with the expectation that they will perform more efficiently when searching for their preferred pure food type compared to mixed food. This difference in efficiency may be reflected in factors such as foraging times, success rates, or other relevant measures.arrow_forwardA population of rodents establishes itself in a habitat that has previously been colonized by its same species. Soon after, the construction of an engineering work causes habitat degradation, which causes the total population to slow down. As time passes, the degradation is greater.a) Formulate mathematically the variation of the population size N of the rodent population at time t, first for the situation described without engineering work and then for the scenario with engineering work. Define the necessary parameters for your model. b) Indicate the equilibrium values of the population N.c) By what time should the population be extinct?arrow_forward
- Which form of conditioning is used most for behavior modification? Why does this form work better? Why would Classical Conditioning help someone in their daily life functioning? Which form of conditioning would you most likely see in a classroom setting? Create your own examples of each form of conditioning. Be sure to include the following information in your answer. In addressing classical conditioning: Identify UCS, UCR, NS, CS, and CR. Discuss any stimulus generalization that you observed. Discuss any extinction and spontaneous that occurred. In addressing operant conditioning: Identify negative and positive reinforcements and punishments. Label the schedule of reinforcement or punishment.arrow_forwardConsider the figure attached. A student in a course on intelligent design theory claims that the graph in part (a) shows that losing the ability to respire actually is adaptive for yeast cells living in small populations. Please read the incomplete sentence that appears immediately below, assess as possible completions the lowercase-Roman-numeral-labelled statements that follow, and click each uppercase-letter-labelled response that is presented below and completes accurately the sentence. An astute student in an evolution course would respond that i. the graph in part (a) shows that selection among mitochondria within yeast cells can lead to fixation for traits that decrease mean fitness for that yeast population. ii. the student in the course on intelligent design is wrong; the yeast cells in the small population group retained completely the ability to respire, as they otherwise would have been unable to harvest energy. iii. a property (e.g., inability to respire) that is…arrow_forwardUse Verbal description of results from graph and then Interpret the graph for Exclusive range sccenario in foraging lab. The interpretations must include Were the results expected and Did they support the hypotheses? If so, state the biological significance of the results from graph. If the results deviated significantly from expected results, discuss the hypotheses onthe basis of expected results and include an explanation of why this might be so. Lastly, state the conclusions drawn from the experiment and their biological relevance. Hypothesis: In the context of exclusive ranges, the foraging times would be significantly affected by the introduction of competition, as opposed to territoriality. This increased competition was expected to deplete food resources and result in harassment by competing individuals.arrow_forward
- Tortoise Calf Fish Man Chick Pig Salamander Rabbit Complete each of the 2 activities for this Task. Activity 1 of 2 Which claim is BEST supported by the evidence provided? O A. The chick and the tortoise have the most similar DNA sequences. O B. The pig and the tortoise have the most similar DNA sequences. O C. The fish and the chick have the most similar DNA sequences. D. The calf and the salamander have the most similar DNA sequences. P Type here to search 144 Q WE Rarrow_forwardName: Date: Galapagos Finch Evolution (HHMI Biointeractive) - https://voutu be/mcM23M-CCog ~16 minutes 1. What is the "mystery of mysteries? 2. The Grants' study on the island of Daphne Major studied what organisms? 3. Where did the 13 species of finches on the islands come from? 4. How did the Grants catch the finches? 5. What features did they measure? 6. What happened in 1977 to the island? 7. What type of birds were more likely to survive after this event? 8. After the El Nino event in 1983, which birds were more likely to survive? 9. What keeps different species from mating on the Galapagos islands? 10. The most likely scenario explaining the different finches on the islands is that: a) different birds migrated to different islands b) one species evolved into many different species 11. Examine the graph below. Summarize what happened to the finch population between 1976 and 1978. 30 1976 Offspring 25- 20- 15- 10- 5- 7.3 7.8 8.3 8.8 9.3 9.8 10.3 10.8 11.3 40 1978 Offspring 30- 20-…arrow_forwardBackground As an expert in the field of mammalian reproductive strategies, you have been hired by the Department of Nature and Island Resources of the West Indies. This organization is a cooperative of several West Indies islands concerned with the loss of biological diversity on their island nations as tourism and development continue to grow. Scientists working on the island of St. Kitts and its sister island Nevis have uncovered what appears to be a previously undiscovered species of rodent. Based on the original description of this animal, it was placed in a genus within the squirrel family. What you have been hired to do is to help save the population on St. Kitts, which is small and threatened by development. The population is so small that individuals are having difficulty finding mates and, in many cases, the reproductive seasons are being delayed by up to one year. When you arrive in the region and begin your observations, you notice that the Nevis population is very healthy…arrow_forward
- Figure is attached Please consider sexual selection operating on red-collared widowbirds assess the lowercase-Roman-numeral-labelled statements that appear immediately below; and click the uppercase-letter-labelled response that is presented below and conveys the most accurate information. i. The specimen depicted at the top in the figure represents the group in which individuals were manipulated experimentally, trimmed so that tail lengths were shortened substantially.ii. The specimen depicted at the bottom in the figure represents the group in which individuals were unmanipulated, left untrimmed.iii. Individuals in the group represented by the specimen at the bottom fared better in condition (measured as body mass relative to length) terms than did individuals in the group represented by the specimen at the top. iv. Individuals in the group represented by the specimen at the bottom spent more time flying and displaying to potential mates than did individuals in the group represented…arrow_forwardMany lines of evidence, including biochemical evidence, show that living birds are direct descendants of dinosaurs. A number of dinosaur lineages had feathered dinosaurs, not just the lineage that includes living birds. Do you think that is it justified to believe that all feathered dinosaurs had behaviors known from living birds? Such behaviors of birds include colonial nesting, sexual displays by males using feathers, males moving to display their ornamental feathers to female mates. Give a brief reason for your answer.arrow_forwardWhich one of the data recording techniques that we used to observe primates was most effective to record events. Why is that so?arrow_forward
arrow_back_ios
SEE MORE QUESTIONS
arrow_forward_ios
Recommended textbooks for you
 Human Anatomy & Physiology (11th Edition)BiologyISBN:9780134580999Author:Elaine N. Marieb, Katja N. HoehnPublisher:PEARSON
 Biology 2eBiologyISBN:9781947172517Author:Matthew Douglas, Jung Choi, Mary Ann ClarkPublisher:OpenStax
 Anatomy & PhysiologyBiologyISBN:9781259398629Author:McKinley, Michael P., O'loughlin, Valerie Dean, Bidle, Theresa StouterPublisher:Mcgraw Hill Education,
 Molecular Biology of the Cell (Sixth Edition)BiologyISBN:9780815344322Author:Bruce Alberts, Alexander D. Johnson, Julian Lewis, David Morgan, Martin Raff, Keith Roberts, Peter WalterPublisher:W. W. Norton & Company
 Laboratory Manual For Human Anatomy & PhysiologyBiologyISBN:9781260159363Author:Martin, Terry R., Prentice-craver, CynthiaPublisher:McGraw-Hill Publishing Co.
 Inquiry Into Life (16th Edition)BiologyISBN:9781260231700Author:Sylvia S. Mader, Michael WindelspechtPublisher:McGraw Hill Education
Human Anatomy & Physiology (11th Edition)
Biology
ISBN:9780134580999
Author:Elaine N. Marieb, Katja N. Hoehn
Publisher:PEARSON
Biology 2e
Biology
ISBN:9781947172517
Author:Matthew Douglas, Jung Choi, Mary Ann Clark
Publisher:OpenStax
Anatomy & Physiology
Biology
ISBN:9781259398629
Author:McKinley, Michael P., O'loughlin, Valerie Dean, Bidle, Theresa Stouter
Publisher:Mcgraw Hill Education,
Molecular Biology of the Cell (Sixth Edition)
Biology
ISBN:9780815344322
Author:Bruce Alberts, Alexander D. Johnson, Julian Lewis, David Morgan, Martin Raff, Keith Roberts, Peter Walter
Publisher:W. W. Norton & Company
Laboratory Manual For Human Anatomy & Physiology
Biology
ISBN:9781260159363
Author:Martin, Terry R., Prentice-craver, Cynthia
Publisher:McGraw-Hill Publishing Co.
Inquiry Into Life (16th Edition)
Biology
ISBN:9781260231700
Author:Sylvia S. Mader, Michael Windelspecht
Publisher:McGraw Hill Education
Genetic Variation and Mutation | 9-1 GCSE Science Biology | OCR, AQA, Edexcel; Author: SnapRevise;https://www.youtube.com/watch?v=bLP8udGGfHU;License: Standard YouTube License, CC-BY