
Related questions
Concept explainers
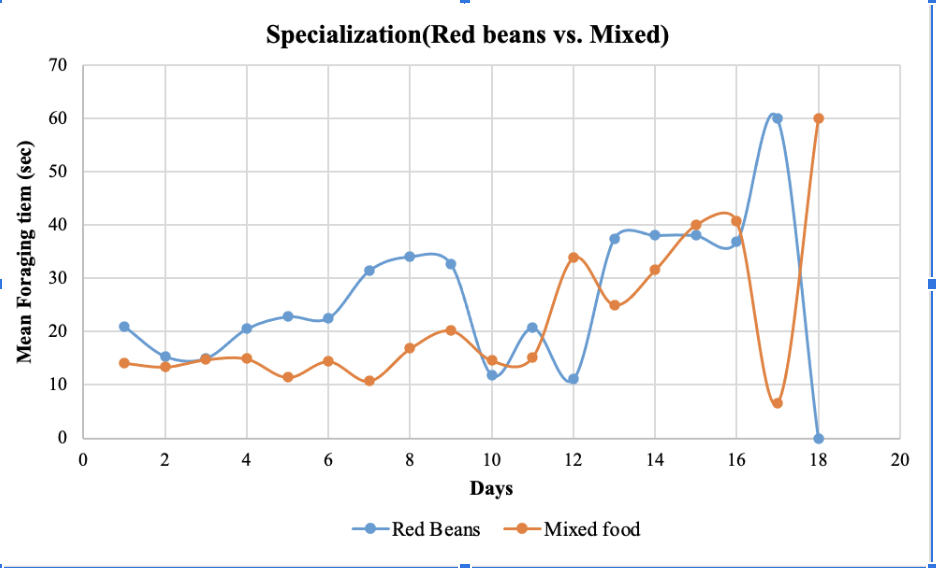
Use Verbal description of results from graph and then Interpret the graph for Speacialization scenario in foraging lab. The interpretations must include:
Were the results expected and Did they support the hypotheses? If so, state the biological significance of the results from graph. If the results deviated significantly from expected results, discuss the hypotheses onthe basis of expected results and include an explanation of why this might be so. Lastly, state the conclusions drawn from the experiment and their biological relevance.
Hypothesis: Within the context of specialization, foragers will exhibit differences in foraging efficiency between pure and mixed food types, with the expectation that they will perform more efficiently when searching for their preferred pure food type compared to mixed food. This difference in efficiency may be reflected in factors such as foraging times, success rates, or other relevant measures.


Step by stepSolved in 4 steps


- Just need the answer to #1arrow_forwardBayesian updating can be a useful tool for thinking about the development of behavior. Imagine the following scenario with respect to an animal’s knowledge of the average density of food in patches in their environment. Which of the following is the most accurate interpretation of this Bayesian view of this animal? Their environment is much richer in food resources than expected Their confidence in their assessment of the state of the environment is greater after they go out and sample the world Their environment is less rich than expected – perhaps there is a drought that has caused a crash in food availability relative to historical conditions All of the abovearrow_forwardGive Detailed Solution with explanationarrow_forward
- TRUE or FALSE: I expect for genetically identical animals thta have been reared in similar conditions to have a similar SD for any paraeter that I decide to measure compared to genetically diverse animals that have been grown in a variety of natural environments.arrow_forwardAnimal activity level Low High An organism's activities can change at regular time intervals, called biological rhythms. The graph below depicts the activity level of a population of animals over a 48-hour period. Use the data presented in the graph to answer each of the following questions: (8 points) Midnight 4 A.M. 8 A.M. Noon 4 P.M. 8 P.M. Midnight 4 A.M. Time of Day 8 A.M. Noon 4 P.M. a. Identify and describe two factors that could affect the physiology and/or behaviors of the animal to result in the observed pattern of activity. b. Select one of the factors and make a prediction regarding its effect on the activity cycle of the animal. Justify your prediction with evidence. 8 P.M. Midnightarrow_forwardContinuing with the side-blotched lizard study... What would be an appropriate control group to use in this study? Question 3 options: female lizards that are kept at different temperatures female lizards that are exposed to another female instead of a male yellow-throated male lizards male lizards with multicolored throats blue-throated male lizardsarrow_forward
- Use Verbal description of results from graph and then Interpret the graph for Exclusive range sccenario in foraging lab. The interpretations must include Were the results expected and Did they support the hypotheses? If so, state the biological significance of the results from graph. If the results deviated significantly from expected results, discuss the hypotheses onthe basis of expected results and include an explanation of why this might be so. Lastly, state the conclusions drawn from the experiment and their biological relevance. Hypothesis: In the context of exclusive ranges, the foraging times would be significantly affected by the introduction of competition, as opposed to territoriality. This increased competition was expected to deplete food resources and result in harassment by competing individuals.arrow_forwardation moths PHASE 4: Clean forest Complete the following steps: Select initial allele frequencies 6 SUBMIT Click Next generation to wait a year for first generation of moths Click Capture moths to monitor population numbers Calculate phenotype frequencies in 5th generation. Record in Lab Data Calculate allele frequencies in 5th generation. Record in Lab Data Calculate genotype frequencies and number of moths in 5th generation. Record in Lab Dataarrow_forward
- Human Anatomy & Physiology (11th Edition)BiologyISBN:9780134580999Author:Elaine N. Marieb, Katja N. HoehnPublisher:PEARSON
 Biology 2eBiologyISBN:9781947172517Author:Matthew Douglas, Jung Choi, Mary Ann ClarkPublisher:OpenStax
 Anatomy & PhysiologyBiologyISBN:9781259398629Author:McKinley, Michael P., O'loughlin, Valerie Dean, Bidle, Theresa StouterPublisher:Mcgraw Hill Education,
  Molecular Biology of the Cell (Sixth Edition)BiologyISBN:9780815344322Author:Bruce Alberts, Alexander D. Johnson, Julian Lewis, David Morgan, Martin Raff, Keith Roberts, Peter WalterPublisher:W. W. Norton & Company
 Laboratory Manual For Human Anatomy & PhysiologyBiologyISBN:9781260159363Author:Martin, Terry R., Prentice-craver, CynthiaPublisher:McGraw-Hill Publishing Co.
 Inquiry Into Life (16th Edition)BiologyISBN:9781260231700Author:Sylvia S. Mader, Michael WindelspechtPublisher:McGraw Hill Education