The graph below depicts the cost curves faced by all firms in a particular industry. While the second graph show the total market demand (in thousands). Initially there are 500 firms. 10 B N 5 20 40 60 80 100 120 140 160 180 200 9 50 100 150 200 250 300 350 400 450 500 Demand in thousands What is the SR profit per firm? -80 240 0300 400
The graph below depicts the cost curves faced by all firms in a particular industry. While the second graph show the total market demand (in thousands). Initially there are 500 firms. 10 B N 5 20 40 60 80 100 120 140 160 180 200 9 50 100 150 200 250 300 350 400 450 500 Demand in thousands What is the SR profit per firm? -80 240 0300 400

Principles of Economics 2e
2nd Edition
ISBN:9781947172364
Author:Steven A. Greenlaw; David Shapiro
Publisher:Steven A. Greenlaw; David Shapiro
Chapter9: Monopoly
Section: Chapter Questions
Problem 16RQ: How does the demand curve perceived by a monopolist compare with the market demand curve?

Related questions
Question
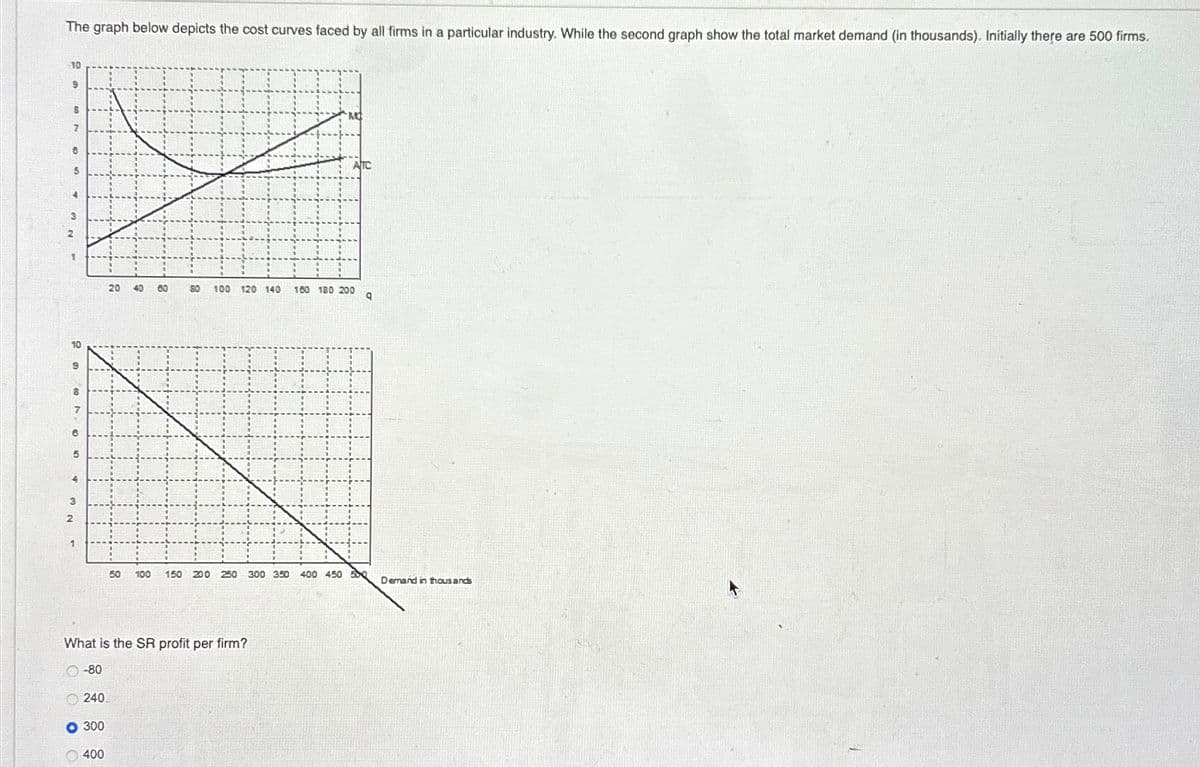
Transcribed Image Text:The graph below depicts the cost curves faced by all firms in a particular industry. While the second graph show the total market demand (in thousands). Initially there are 500 firms.
10
B
N
5
20
40
60
80 100 120 140
160 180 200
9
50
100 150 200 250 300 350
400 450 500
Demand in thousands
What is the SR profit per firm?
-80
240
0300
400
Expert Solution
This question has been solved!
Explore an expertly crafted, step-by-step solution for a thorough understanding of key concepts.

This is a popular solution!

Trending now
This is a popular solution!

Step by step
Solved in 2 steps

Recommended textbooks for you
Principles of Economics 2e
Economics
ISBN:
9781947172364
Author:
Steven A. Greenlaw; David Shapiro
Publisher:
OpenStax


Principles of Economics 2e
Economics
ISBN:
9781947172364
Author:
Steven A. Greenlaw; David Shapiro
Publisher:
OpenStax


Economics (MindTap Course List)
Economics
ISBN:
9781337617383
Author:
Roger A. Arnold
Publisher:
Cengage Learning
