Question One The figure below shows three alternative distributions of land ownership in a village with people and 100 hectares of land. a. Draw the Lorenz curves for each case. 10 points b. For cases I and III, calculate the Girl 10 points c For case il, show on the Lorenz curve diagram how the Gini coefficient can be calculated. 5 points Question One The figure below shows three alternative distributions of land ownership in a village with 10 people and 100 hectares of land. a. Draw the Lorenz curves for each case. b. For cases I and III, calculate the Gini c. For case II, show on the Lorenz curve diagram how the Gini coefficient can be calculate 80 people own nothing 20 people own 5 hectares each 40 people own nothing 40 people own 20 people own 1 hectare each 3 hectares each 100 people own 1 hectare each
Question One The figure below shows three alternative distributions of land ownership in a village with people and 100 hectares of land. a. Draw the Lorenz curves for each case. 10 points b. For cases I and III, calculate the Girl 10 points c For case il, show on the Lorenz curve diagram how the Gini coefficient can be calculated. 5 points Question One The figure below shows three alternative distributions of land ownership in a village with 10 people and 100 hectares of land. a. Draw the Lorenz curves for each case. b. For cases I and III, calculate the Gini c. For case II, show on the Lorenz curve diagram how the Gini coefficient can be calculate 80 people own nothing 20 people own 5 hectares each 40 people own nothing 40 people own 20 people own 1 hectare each 3 hectares each 100 people own 1 hectare each

Principles of Economics 2e
2nd Edition
ISBN:9781947172364
Author:Steven A. Greenlaw; David Shapiro
Publisher:Steven A. Greenlaw; David Shapiro
Chapter15: Poverty And Economic Inequality
Section: Chapter Questions
Problem 8SCQ: Using two demand and supply diagrams, one for the low-wage labor market and one for the high-wage...

Related questions
Question
Transcribed Image Text:Question One The figure below shows three alternative distributions of land ownership in a village with people and 100
hectares of land. a. Draw the Lorenz curves for each case. 10 points b. For cases I and III, calculate the Girl 10 points c
For case il, show on the Lorenz curve diagram how the Gini coefficient can be calculated. 5 points
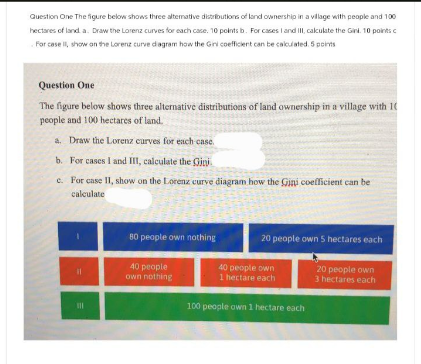
Question One
The figure below shows three alternative distributions of land ownership in a village with 10
people and 100 hectares of land.
a. Draw the Lorenz curves for each case.
b. For cases I and III, calculate the Gini
c. For case II, show on the Lorenz curve diagram how the Gini coefficient can be
calculate
80 people own nothing
20 people own 5 hectares each
40 people
own nothing
40 people own
20 people own
1 hectare each
3 hectares each
100 people own 1 hectare each
Expert Solution
This question has been solved!
Explore an expertly crafted, step-by-step solution for a thorough understanding of key concepts.

This is a popular solution!

Trending now
This is a popular solution!

Step by step
Solved in 2 steps with 1 images

Recommended textbooks for you
Principles of Economics 2e
Economics
ISBN:
9781947172364
Author:
Steven A. Greenlaw; David Shapiro
Publisher:
OpenStax

Principles of Microeconomics (MindTap Course List)
Economics
ISBN:
9781305971493
Author:
N. Gregory Mankiw
Publisher:
Cengage Learning

Principles of Economics (MindTap Course List)
Economics
ISBN:
9781305585126
Author:
N. Gregory Mankiw
Publisher:
Cengage Learning
Principles of Economics 2e
Economics
ISBN:
9781947172364
Author:
Steven A. Greenlaw; David Shapiro
Publisher:
OpenStax
Principles of Microeconomics (MindTap Course List)
Economics
ISBN:
9781305971493
Author:
N. Gregory Mankiw
Publisher:
Cengage Learning
Principles of Economics (MindTap Course List)
Economics
ISBN:
9781305585126
Author:
N. Gregory Mankiw
Publisher:
Cengage Learning

Principles of Economics, 7th Edition (MindTap Cou…
Economics
ISBN:
9781285165875
Author:
N. Gregory Mankiw
Publisher:
Cengage Learning

Exploring Economics
Economics
ISBN:
9781544336329
Author:
Robert L. Sexton
Publisher:
SAGE Publications, Inc
