
ENGR.ECONOMIC ANALYSIS
14th Edition
ISBN: 9780190931919
Author: NEWNAN
Publisher: Oxford University Press
expand_more
expand_more
format_list_bulleted
Related questions
Question
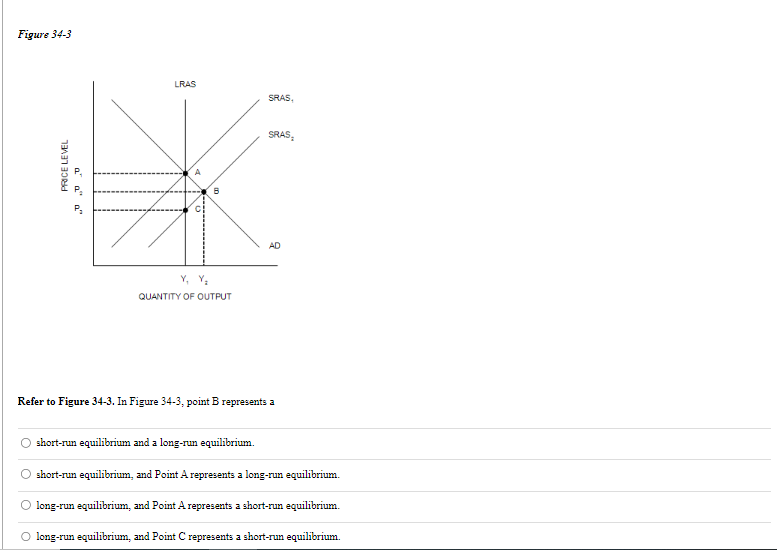

Transcribed Image Text:Figure 34-3
PRICE LEVEL
aaa"
LRAS
B
Y, Y₂
QUANTITY OF OUTPUT
SRAS.
SRAS
AD
Refer to Figure 34-3. In Figure 34-3, point B represents a
short-run equilibrium and a long-run equilibrium.
short-run equilibrium, and Point A represents a long-run equilibrium.
long-run equilibrium, and Point A represents a short-run equilibrium.
long-run equilibrium, and Point C represents a short-run equilibrium.
Expert Solution
This question has been solved!
Explore an expertly crafted, step-by-step solution for a thorough understanding of key concepts.

This is a popular solution

Trending nowThis is a popular solution!

Step by stepSolved in 2 steps

Knowledge Booster

Similar questions
- K How will an increase in the number of sellers of tablets affect the market for this product? A. Demand will increase causing the equilibrium price to increase and the equilibrium quantity to increase. OB. Supply will increase causing the equilibrium price to decrease and the equilibrium quantity to increase. OC. Supply will decrease causing the equilibrium price to decrease and the equilibrium quantity to increase. O D. Supply will increase causing the equilibrium price to increase and the equilibrium quantity to decrease.arrow_forwardThe blue curve on the following graph represents the demand curve facing a firm that can set its own prices. Use the graph input tool to help you answer the following questions. You will not be graded on any changes you make to this graph. Note: Once you enter a value in a white field, the graph and any corresponding amounts in each grey field will change accordingly. Graph Input Tool Market for Goods 200 I Quantity Demanded 180 10 (Units) 160 140 Demand Price 100.00 (Dollars per unit) 120 100 80 60 Demand 40 20 6 8 10 QUANTITY (Units) 0 2 4 8 12 14 16 18 20 On the graph input tool, change the number found in the Quantity Demanded field to determine the prices that correspond to the production of 0, 4, 8, 10, 12, 16, and 20 units of output. Calculate the total revenue for each of these production levels. Then, on the following graph, use the green points (triangle symbol) to plot the results. 1000 900 Total Revenue 800 700 600 500 400 300 200 100 + 2 4 6 8 10 12 14 16 18 20 QUANTITY…arrow_forwardImagine there is a market for erasers. This market has many companies selling identical erasers. After several years, however, many of these firms combine and become a few large companies. Now this market for erasers is only served by five firms selling erasers. Because of this, you would anticipate O an increase in total erasers sold and a decrease in the price of erasers. an increase in total erasers sold and an increase in the price of erasers. O a decrease in total erasers sold and a decrease in the price of erasers. O a decrease in total erasers sold and an increase in the price of erasers.arrow_forward
- If the price of cream (an input into ice cream production) increases, then an ice cream store's curve shifts to the Select an answer and submit. For keyboard navigation, use the up/down arrow keys to select an answer. a supply; right supply; left demand; right demand; left Parrow_forwardThe relationship between quantity supplied and the price of output is such that O an increase in quantity will automatically lead to a reduction in price. O quantity will decrease as the number of firms increases. O an increase in price will produce an inward shift in the supply curve. O an increase in price will lead to an increase in quantity supplied.arrow_forward33arrow_forward
- Question 2arrow_forwardSupply and Demand: End of Chapter Problems 6. Suppose the market for tomatoes is in equilibrium, and events occur that simultaneously shift both the demand and supply curves to the right. If this is the only information you have, what can you say about how the equilibrium price or quantity would be affected? The equilibrium O quantity would increase, whereas the direction of the change in equilibrium price would be indeterminate. price would increase, whereas the direction of the change in equilibrium quantity would be indeterminate. O price and quantity would both decrease. price and quantity would both increase. Question Source: Chiang 4e - Economics Principles For A Changing World Publisher: Worth Publishers a 9:39 PM 64°F 10/13/2021 SParrow_forwardQuestion 25 Many consumer items eventually go out of style, and because fewer people want these items, demand for them drops. When this happens, we usually see production of these items stop. What happens to the equilibrium price and equilibrium quantity in a market like this? The equilibrium price is indeterminate and equilibrium quantity goes up. The equilibrium price is indeterminate and equilibrium quantity goes down. O The equilibrium price goes down and equilibrium quantity is indeterminate. O The equilibrium price goes up and equilibrium quantity goes up. O The equilibrium price goes up and equilibrium quantity is indeterminate.arrow_forward
- 8. Short-run and long-run effects of a shift in demand Suppose that the tempeh industry is initially operating in long-run equilibrium at a price level of $5 per pound of tempeh and quantity of 100 million pounds per year. Suppose a leading foodie video blogger raises awareness for a scholarly article that links tempeh consumption to premature hair loss and unhealthy skin. The viral video is expected to cause consumers to demand less tempeh at every price. In the short run, firms will respond by producing the same amount of tempeh and running at a loss Shift the demand curve, the supply curve, or both on the following graph to illustrate these short-run effects of the viral video. PRICE (Dollars per pound) 10 9 8 1 0 0 20 Supply 40 60 80 100 120 140 QUANTITY (Millions of pounds) In the long run, some firms will respond by D. D₂ 160 180 200 consumer demand returns to its original level Demand Supply (?) exiting the industry until and unhealthy skin. The viral video is expected to cause…arrow_forwardHomework (Ch 09) 1. The supply curve in the very short run The following graph shows the annual demand for tortilla chip consumption, which is initially in long-run equilibrium at point D. Suppose that tortilla chips are sold in a perfectly competitive market, and tastes shift away from tortilla chips so that demand shifts leftward from D₁ to D₂. Use the purple line (diamond symbol) to illustrate the supply curve in the very short run. Make sure the line passes through two of the starred points on the graph. PRICE (Dollars per bag) 10 9 0 1 2 C D A B D₂ 3 4 5 6 7 8 QUANTITY (Millions of bags per year) 9 D. 10 Short-Run Supply Curve ?arrow_forward# For a firm, the supply curve is given to be as:- 2P - 30 = Q And the demand curve is give to be as:- 15 - P = Q Calculate the equilibrium price and equilibrium Quantityarrow_forward
arrow_back_ios
SEE MORE QUESTIONS
arrow_forward_ios
Recommended textbooks for you
 Principles of Economics (12th Edition)EconomicsISBN:9780134078779Author:Karl E. Case, Ray C. Fair, Sharon E. OsterPublisher:PEARSON
 Engineering Economy (17th Edition)EconomicsISBN:9780134870069Author:William G. Sullivan, Elin M. Wicks, C. Patrick KoellingPublisher:PEARSON
 Principles of Economics (MindTap Course List)EconomicsISBN:9781305585126Author:N. Gregory MankiwPublisher:Cengage Learning
 Managerial Economics: A Problem Solving ApproachEconomicsISBN:9781337106665Author:Luke M. Froeb, Brian T. McCann, Michael R. Ward, Mike ShorPublisher:Cengage Learning
 Managerial Economics & Business Strategy (Mcgraw-...EconomicsISBN:9781259290619Author:Michael Baye, Jeff PrincePublisher:McGraw-Hill Education
Principles of Economics (12th Edition)
Economics
ISBN:9780134078779
Author:Karl E. Case, Ray C. Fair, Sharon E. Oster
Publisher:PEARSON
Engineering Economy (17th Edition)
Economics
ISBN:9780134870069
Author:William G. Sullivan, Elin M. Wicks, C. Patrick Koelling
Publisher:PEARSON
Principles of Economics (MindTap Course List)
Economics
ISBN:9781305585126
Author:N. Gregory Mankiw
Publisher:Cengage Learning
Managerial Economics: A Problem Solving Approach
Economics
ISBN:9781337106665
Author:Luke M. Froeb, Brian T. McCann, Michael R. Ward, Mike Shor
Publisher:Cengage Learning
Managerial Economics & Business Strategy (Mcgraw-...
Economics
ISBN:9781259290619
Author:Michael Baye, Jeff Prince
Publisher:McGraw-Hill Education