
Financial Accounting
14th Edition
ISBN: 9781305088436
Author: Carl Warren, Jim Reeve, Jonathan Duchac
Publisher: Cengage Learning
expand_more
expand_more
format_list_bulleted
Related questions
Question
Hello tutor solve this general accounting problem
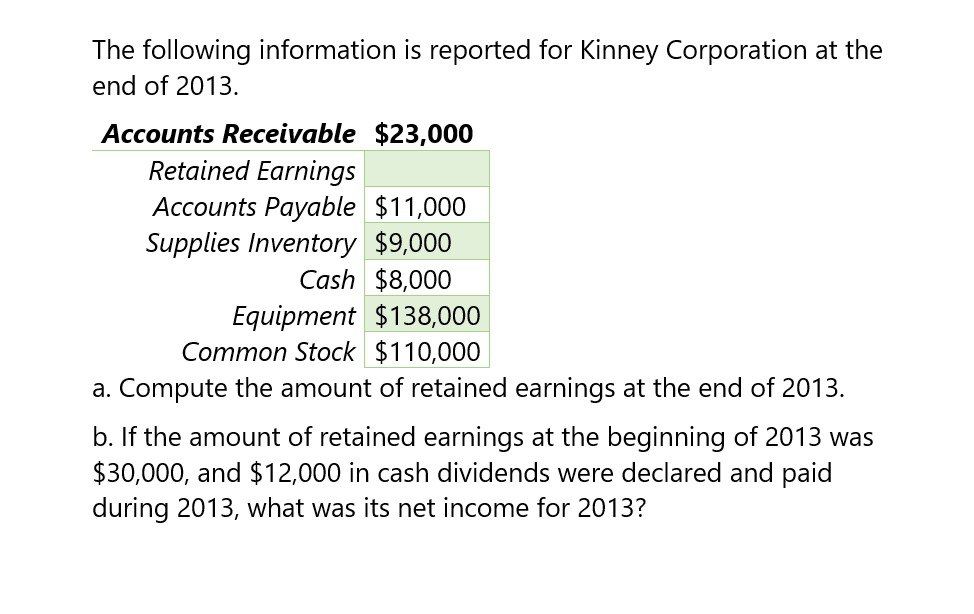

Transcribed Image Text:The following information is reported for Kinney Corporation at the
end of 2013.
Accounts Receivable $23,000
Retained Earnings
Accounts Payable $11,000
Supplies Inventory $9,000
Cash $8,000
Equipment $138,000
Common Stock $110,000
a. Compute the amount of retained earnings at the end of 2013.
b. If the amount of retained earnings at the beginning of 2013 was
$30,000, and $12,000 in cash dividends were declared and paid
during 2013, what was its net income for 2013?
Expert Solution
This question has been solved!
Explore an expertly crafted, step-by-step solution for a thorough understanding of key concepts.

Step by stepSolved in 2 steps with 2 images

Knowledge Booster

Similar questions
- Juroe Company provided the following income statement for last year: Juroes balance sheet as of December 31 last year showed total liabilities of 10,250,000, total equity of 6,150,000, and total assets of 16,400,000. Required: Note: Round answers to two decimal places. 1. Calculate the times-interest-earned ratio. 2. Calculate the debt ratio. 3. Calculate the debt-to-equity ratio.arrow_forwardRebert Inc. showed the following balances for last year: Reberts net income for last year was 3,182,000. Refer to the information for Rebert Inc. above. Required: 1. Calculate the average common stockholders equity. 2. Calculate the return on stockholders equity.arrow_forwardCalculate the P/R for (WMT) as of November 14, 2017, when the company's stock price closed at $91.09.2 The company's profit for the fiscal year ending January 31, 2017, was US$13.64 billion, and its number of shares outstanding was 3.1 billion.arrow_forward
- The comparative financial statements of Bettancort Inc. are as follows. The market price of Bettancort Inc. common stock was $71.25 on December 31, 2014. InstructionsDetermine the following measures for 2014, rounding to one decimal place:1. a.Working capital b. Current ratio c. Quick ratiod. Accounts receivable turnovere. Number of days' sales in receivablesf. Inventory turnoverg. Number of days' sales in inventoryh. Ratio of fixed assets to long-term liabilitiesi. Ratio of liabilities to stockholders’ equityj. Number of times interest charges are earnedk. Number of times preferred dividends are earned2. a. Ratio of net sales to assetsb. Rate earned on total assetsc. Rate earned on stockholders' equityd. Rate earned on common stockholders' equitye. Earnings per share on common stockf. Price-earnings ratiog. Dividends per share of common stockh. Dividend yieldarrow_forwardThe following selected data were taken from the financial statements of Vidahill Inc. for December 31, 2017, 20Y6, and 2015: December 31 Total assets Notes payable (8% interest) Common stock Preferred 4% stock, $100 part (no change during year) 20Y7 $204,000 70,000 28,000 14,000 20Y6 $184,000 70,000 28,000 14,000 73,380 Retained earnings 51,840 42,000 The 2017 net income was $22,100, and the 20Y6 net income was $10,400. No dividends on common stock were declared between 20Y5 and 2017. Preferred dividends were declared and paid in full in 2016 and 20Y7. a. Determine the return on total assets, the rate earned on stockholders' equity, and the return on common stockholders' equity for the years 20Y6 and 20Y7. When required, round to one decimal place. 20Y7 20Y6 Return on total assets Return on stockholders' equity Return on common stockholders' equity b. The profitability ratios indicate that Vidahill Inc.'s profitability has % % 20Y5 $164,000 70,000 28,000 % 14,000 M % % Since the rate…arrow_forwardUse the following financial statement information as of the end of each year: please answer the accounting questionarrow_forward
- The following data are available for XYZ Corporation for years 2014 and 2013. XYZ Corporation Statement of Financial Position As of December 31 Change Peso % 2013 2014 Assets Cash and equivalents Receivables Inventories Prepayments and others Total Current Assets 14,000 28,800 54,000 4,800 101,600 16,000 55,600 85,600 _7,400 164,600 2,000 26,800 ? 93.06% ? 2,600 54.17% 62.01% Property, Plant & Equipment - net of depreciation Total Assets 43,200 73,400 238,000 143.05% 30,200 131.800 Liabilities and Equity Notes payable to banks Accounts payable Accrued liabilities Income taxes payable Total current liabilities Share capital Retained earnings Total equity Total liabilities and equity 10,000 31,600 4,200 _ 5,800 51,600 44,600 35.600 80,200 131,800 54,000 55,400 6,800 7,000 123,200 44,600 70,200 44,000 23,800 2,600 .? ? 440.00% 61.90% 0.00% 34,600 34,600 43,14% 114,800 238.000 XYZ Corporation Income Statement Years ended December 31 (P thousands) Change Peso 2013 2014 266,400 191,400…arrow_forwardThe following income statement and balance sheets for Virtual Gaming Systems are provided. VIRTUAL GAMING SYSTEMS Income Statement For the year ended December 31, 2021 Net sales Cost of goods sold Gross profit Expenses: Operating expenses. Depreciation expense Loss on sale of land Interest expense Income tax expense Total expenses Net income Assets Current assets: Cash Accounts receivable Inventory Prepaid rent Long-term assets: Investment in bonds $852,000 27,000 7,400 12,000 42,000 $3,006,000 1,944,000 1,062,000 940, 400 $ 121,600 VIRTUAL GAMING SYSTEMS Land Equipment Less: Accumulated depreciation Total assets Liabilities and Stockholders' Equity Current liabilities: Accounts payable Interest payable Income tax payable. Long-term liabilities: Notes payable Stockholders' equity: Common stock Retained earnings Balance Sheets December 31 2021 $180,000 75,000 99,000 11,400 99,000 204,000 264,000 (63,000) $869,400 $ 60,000 4,800 12,000 279,000 294,000 219,600 2020 $138,000 54,000 129,000…arrow_forwardGiven the data in the following table, the entry for Inventories on the 2023 common-sized balance sheet was %.arrow_forward
- Selected information from the comparative financial statements of AppleVerse Company for the year ended December 31 appears below: 2018 2017 Php Php Accounts receivable (net) 175,000 200,000 Inventory 130,000 150,000 Total assets 1,100,000 800,000 Current liabilities 140,000 110,000 Long-term debt 410,000 300,000 Net credit sales 800,000 700,000 Cost of goods sold 600,000 530.000 Interest expense 40.000 25,000 Income tax expense 60.000 29,000 Net income 150.000 85,000 Net cash provided by operating 220,000 135,000 activities Compute for the Receivables Turnover for 2018. O 2.13 O 4.27 O 5.95 O 3.23arrow_forwardThe 2024 Income statement of Adrian Express reports sales of $18,957,000, cost of goods sold of $11,971,500, and net Income of $1,690,000. Balance sheet Information is provided in the following table. Assets Current assets: Cash Accounts receivable Inventory Long-term assets Total assets Liabilities and stockholders' Equity Current liabilities Long-term debt Common stock Retained earnings Total liabilities and stockholders' equity Industry averages for the following four ratios are as follows: 25 days 60 days 2 to 1 35% ADRIAN EXPRESS Balance Sheets December 31, 2024 and 2023 Req 1 Req 2 and 3 Complete this question by entering your answers in the tabs below. Ratios 2024 Average collection period Average days in inventory Current ratio Debt to equity ratio $ 690,000 1,580,000 1,980,000 4,890,000 $ 9,140,000 Average collection period Average days in inventory Current ratio Debt to equity ratio Required: 1. Calculate the four ratios listed above for Adrian Express In 2024 assuming all…arrow_forwardThe following selected data were taken from the financial statements of The O'Malley Group Inc. for December 31, 2015, 2014, and 2013: December 31 Total assets Notes payable (10% interest) Common stock Preferred $4 stock, $100 par Retained earnings Net income 2015 $201,000 70,000 28,000 14,000 79,000 15,920 20Y4 $181,000 70,000 28,000 20Y5 14,000 63,000 16,940 No dividends on common stock were declared between 2013 and 2015. a. Determine the return on total assets, the return on stockholders' equity, and the return on common stockholders' equity for the years 2014 and 2015. Round your percentage answers to one decimal place. 20Y3 $161,000 70,000 28,000 % Return on total assets Return on stockholders' equity Return on common stockholders' equity b. What conclusions can be drawn from these data as to the company's profitability? % 14,000 42,000 13,552 20Y4 % % %arrow_forward
arrow_back_ios
SEE MORE QUESTIONS
arrow_forward_ios
Recommended textbooks for you
- Financial AccountingAccountingISBN:9781305088436Author:Carl Warren, Jim Reeve, Jonathan DuchacPublisher:Cengage Learning
 Managerial Accounting: The Cornerstone of Busines...AccountingISBN:9781337115773Author:Maryanne M. Mowen, Don R. Hansen, Dan L. HeitgerPublisher:Cengage Learning
Financial Accounting
Accounting
ISBN:9781305088436
Author:Carl Warren, Jim Reeve, Jonathan Duchac
Publisher:Cengage Learning
Managerial Accounting: The Cornerstone of Busines...
Accounting
ISBN:9781337115773
Author:Maryanne M. Mowen, Don R. Hansen, Dan L. Heitger
Publisher:Cengage Learning