
FINANCIAL ACCOUNTING
10th Edition
ISBN: 9781259964947
Author: Libby
Publisher: MCG
expand_more
expand_more
format_list_bulleted
Related questions
Question
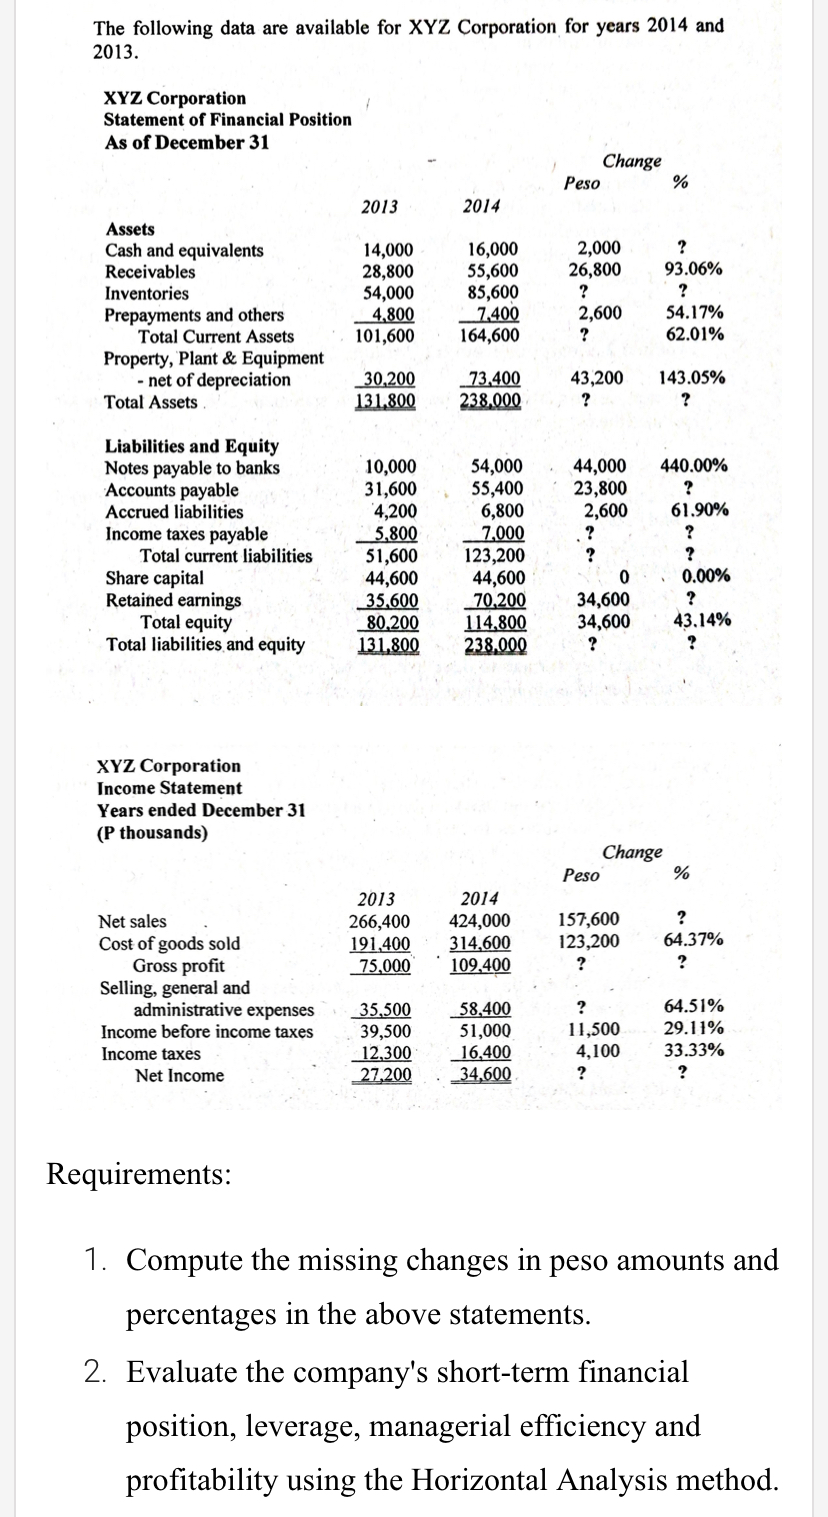

Transcribed Image Text:The following data are available for XYZ Corporation for years 2014 and
2013.
XYZ Corporation
Statement of Financial Position
As of December 31
Change
Peso
%
2013
2014
Assets
Cash and equivalents
Receivables
Inventories
Prepayments and others
Total Current Assets
14,000
28,800
54,000
4,800
101,600
16,000
55,600
85,600
_7,400
164,600
2,000
26,800
?
93.06%
?
2,600
54.17%
62.01%
Property, Plant & Equipment
- net of depreciation
Total Assets
43,200
73,400
238,000
143.05%
30,200
131.800
Liabilities and Equity
Notes payable to banks
Accounts payable
Accrued liabilities
Income taxes payable
Total current liabilities
Share capital
Retained earnings
Total equity
Total liabilities and equity
10,000
31,600
4,200
_ 5,800
51,600
44,600
35.600
80,200
131,800
54,000
55,400
6,800
7,000
123,200
44,600
70,200
44,000
23,800
2,600
.?
?
440.00%
61.90%
0.00%
34,600
34,600
43,14%
114,800
238.000
XYZ Corporation
Income Statement
Years ended December 31
(P thousands)
Change
Peso
2013
2014
266,400
191,400
75,000
424,000
314,600
109.400
157,600
123,200
Net sales
64.37%
Cost of goods sold
Gross profit
Selling, general and
administrative expenses
Income before income taxes
?
?
64.51%
35,500
39,500
12,300
27,200
58.400
51,000
_16,400
_34,600
11,500
4,100
29.11%
Income taxes
33.33%
Net Income
?
?
Requirements:
1. Compute the missing changes in peso amounts and
percentages in the above statements.
2.
Evaluate the company's short-term financial
position, leverage, managerial efficiency and
profitability using the Horizontal Analysis method.
Expert Solution
This question has been solved!
Explore an expertly crafted, step-by-step solution for a thorough understanding of key concepts.

This is a popular solution

Trending nowThis is a popular solution!

Step by stepSolved in 4 steps with 3 images

Knowledge Booster


Learn more about
Need a deep-dive on the concept behind this application? Look no further. Learn more about this topic, accounting and related others by exploring similar questions and additional content below.Similar questions
- Condensed financial data are presented below for the Tulsa Corporation: Accounts receivable Inventory C. d. Total current assets Total assets Current liabilities Long-term liabilities Sales Cost of goods sold Interest expense Net income Tax rate 2021 $277,500 310,000 675,000 800,000 700,000 250,000 200,000 77,500 75,000 1,640,000 985,000 10,000 130,000 25% 2020 $230,000 250,000 565,000 The profit margin used to calculate return on assets for 2021 is (rounded): a. b. 8.9% 16.3% 17.2% 18.3%arrow_forwardFollowing is the balance sheet for 3M Company. At December 31 2015 2014 Cash and cash equivalents $ 1,798 $ 1,897 Marketable securities-current 118 1,439 Accounts receivable, net 4,154 4,238 Inventories 3,518 3,706 Other current assets 1,398 1,023 Total current assets 10,986 12,303 Marketable securities-noncurrent 126 117 Property, plant and equipment--net 8,515 8,489 Goodwill 9,249 7,050 Intangible assets-net 2,601 1,435 Prepaid pension benefits 188 46 1,053 $32,718 1,769 $31,209 Other assets Total assets $ $ Short-term debt & current portion of LT debt Accounts payable 2,044 106 1,694 1,807 Accrued payroll 644 732 Accrued income taxes 332 435 Other current liabilities 2,404 2,884 Total current liabilities 7,118 5,964 Long-term debt 8,753 6,705 Pension and postretirement benefits 3,520 3,843 Other liabilities 1,580 1,555 Total liabilities 20,971 18,067 3M Company shareholders' equity: Common stock 9. Additional paid-in capital Retained earnings 4,791 4,379 36,575 34,317 Treasury stock…arrow_forwardThe following are taken from the financial statements of Curry Company as of December 2021. Assets: Cash 341,600 Account Receivable 200,000 Inventory 308,400 Property, Plant, Equipment 500,000 Liabilities: Notes payable 280,000 Accounts Payable 781,700 Bonds payable 2,000,000 6. What is the company's current ratio? a. 0.80 b. 0.51 c. 0.21 d. 3.03 7. What is the company's quick ratio? a. 0.51 b. 0.80 c. 1.93 d. 0.32arrow_forward
- Pizza, Inc. balance sheet statement for December 31. 2015 with the following information tound to the nearest thousand i Data Table Barron Pizza, Inc. Balance Sheet as of Decemb Retained earnings: $43,512 Accounts payable: $74,547 Accounts receivable: $34,808 Common stock: $119,856 Cash: $8,258 Short-term debt $188 ($ in thousands) LIABILIT Current Inventory: $23,487 Goodwill: $48,302 Long-term debt S80,147 Other noncurrent liabilities: $42,597 Net plant, property, and equipment. $192,340 Other noncurrent assets.$16,738 Long-term investments: $22,330 Other current assets: $14,584 Total cur Total liat OWNER! Print Done a意前 %24 %24 %24 %24 %24arrow_forwardThe following information is available for Cullumber Products: 2014 2013 Accounts receivable $76,800 $94,720 Cost of goods sold 675,840 742,400 Inventory (ending) 66,560 87,040 Net cash provided by operating activities 281,600 217,600 Net sales 1,157,760 1,203,200 Capital expenditures 51,200 48,640 Dividends 31,104 40,960 Compute the following for 2014: (Round answers to 1 decimal place, e.g. 52.7. Use 365 days for calculation.) Accounts receivable turnover enter a number of times rounded to 1 decimal place times Average collection period enter a number of days rounded to 1 decimal place daysarrow_forwardBelow are Laiho Industries' 2017 and 2018 balance sheet items: Cash Accounts Receivable Long-Term Debt Accounts Payable Common Stock (total value) Notes Payable Net Fixed Assets Accruals Inventories Retained Earnings $ $ $ $ LA $ LA $ LA $ LA LA 2018 102,850.00 103,365.00 76,264.00 30,761.00 100,000.00 $ $ $ $ Sm 16,717.00 $ 67,165.00 $ 30,477.00 $ 38,444.00 $ 57,605.00 2017 89,725.00 85,527.00 63,914.00 23,109.00 90,000.00 14,217.00 42,436.00 22,656.00 34,982.00 38,774.00 Sales for 2018 were $455,150, and EBITDA was 15% of sales. Furthermore, depreciation and amortization were 11% of net fixed assets, interest was $8,575, the corporate tax rate was 40%, and Laiho pays 40% of its net income as dividends. Given this information, construct the firm's 2018 income statement, statement of cash flows, and statement of owner's equity. Then answer the questions below.arrow_forward
- How to calculate Net Operating Asset from this balance sheet for fiscal year-end 2015 .arrow_forwardAccounts Receivable and Inventory Ratios Bell Company had the following current assets at year-end: Cash $72,500 Short-term investments 123,500 Accounts receivable (net) 425,000 Inventory 500,000 Prepaid expenses 29,000 Current assets $1,150,000 The company had net sales for the year of $2,205,000 and cost of goods sold of $1,347,500.At the beginning of the year, Bell’s accounts receivable (net) were $352,000 and itsInventory was $429,000.a. What is the company’s accounts receivable turnover for the year? (Round to two decimal places.) Answer b. What is the company’s average collection period for the year? (Round to one decimal place.) Answer c. What is the company’s inventory turnover for the year? (Round to two decimal places.) Answer d. What is the company’s days’ sales in inventory for the year? (Round to one decimal place.) Answerarrow_forwardBalance Sheets as of December 31, 2015 and 2016 2015 2016 2015 2016 Assets Liabilities and Owners' Equity Cash Accounts receivable Inventory Net fixed assets 21,900 24,300 Common stock $ 850 $ 1,210 126 Accounts payable 1,370 Short-term notes payable $ 1,080 $ 970 500 0 4,350 4,610 Long-term debt 11,900 13,500 6,000 6,200 Retained earnings Total assets $28,310 $30,406 Total liabilities and owners' equity 8,830 $28,310 $30,406 9,736 2016 Income Statement Sales Cost of goods sold Depreciation Interest Taxes Net income $30,710 18,470 6,132 744 1,824 $ 3,540 What are the values of the three components of the DuPont identity? Use ending balance sheet values. Multiple Choicearrow_forward
- Use the current asset section of the balance sheets of the Waverley Company as of June 30, 2017 and 2016 presented below to answer the questions that follow. 2017 2016Cash and cash equivalents R 75,000 R 58,800Trade accounts receivable, net 157,500 193,200Inventory 208,200 253,400Other current assets 18,400 15,500Total current assets R 459,100 R 520,900Total assets R2,650,000 R3,430,000Required:Complete a horizontal analysis of the current asset section of Waverley Company’s balance sheet for 2017. Your answers for “% Change” should be rounded to one decimal place, e.g.,…arrow_forwardRatio Analysis Presented below are summary financial data from Pompeo's annual report: Amounts in millions Balance sheet Cash and cash equivalents $6,328 Marketable securities 63,298 Accounts receivable (net) 32,785 Total current assets 136,808 Total assets 430,773 Current liabilities 113,172 Long-term debt 21,837 Shareholders' equity 204,834 Income Statement Interest expense 1,257 Net income before taxes 42,021 Calculate the following ratios: (round to two decimal places) a. Times-interest-earned ratio b. Quick ratioarrow_forwardCurrent Assets Cash A/R Inventory Total Net Plant & Equip Total Assets Tomson Corporation 2013 and 2014 Statement of Financial Position Assets 2013 $ 8,436 21,530 38.760 $ 68,726 $ 226.706 $295,432 2014 $ 10,157 23,406 42.650 $ 76,213 Current Liabilities A/P Notes Payable Total 1. The current ratio for each year 2. The quick ratio for each year Long-term Debt Owner's Equity Common Stock & Paid-in Surplus Retained Earnings $248,306 Total Total Liabilities & $324,519 Owners Equity Liabilities 3. The cash ratio for each year 4. The NWC to total assets ratio for each year 2013 5. The debt-equity ratio and the equity multiplier for each year 6. The total debt ratio and the long-term debt ratio for each year Round all answers to 2 decimal places. $ 43,050 18.384 $61.434 $ 25.000 $ 40,000 168.998 $ 208,998 $ 295,432 2014 1. Prepare: The 2014 combined common-size, common-base year statement of financial position for Tomson. Round your intermediate calculations to 2 decimal places…arrow_forward
arrow_back_ios
SEE MORE QUESTIONS
arrow_forward_ios
Recommended textbooks for you
 AccountingAccountingISBN:9781337272094Author:WARREN, Carl S., Reeve, James M., Duchac, Jonathan E.Publisher:Cengage Learning,
 Accounting Information SystemsAccountingISBN:9781337619202Author:Hall, James A.Publisher:Cengage Learning,
 Horngren's Cost Accounting: A Managerial Emphasis...AccountingISBN:9780134475585Author:Srikant M. Datar, Madhav V. RajanPublisher:PEARSON
 Intermediate AccountingAccountingISBN:9781259722660Author:J. David Spiceland, Mark W. Nelson, Wayne M ThomasPublisher:McGraw-Hill Education
 Financial and Managerial AccountingAccountingISBN:9781259726705Author:John J Wild, Ken W. Shaw, Barbara Chiappetta Fundamental Accounting PrinciplesPublisher:McGraw-Hill Education
Accounting
Accounting
ISBN:9781337272094
Author:WARREN, Carl S., Reeve, James M., Duchac, Jonathan E.
Publisher:Cengage Learning,
Accounting Information Systems
Accounting
ISBN:9781337619202
Author:Hall, James A.
Publisher:Cengage Learning,
Horngren's Cost Accounting: A Managerial Emphasis...
Accounting
ISBN:9780134475585
Author:Srikant M. Datar, Madhav V. Rajan
Publisher:PEARSON
Intermediate Accounting
Accounting
ISBN:9781259722660
Author:J. David Spiceland, Mark W. Nelson, Wayne M Thomas
Publisher:McGraw-Hill Education
Financial and Managerial Accounting
Accounting
ISBN:9781259726705
Author:John J Wild, Ken W. Shaw, Barbara Chiappetta Fundamental Accounting Principles
Publisher:McGraw-Hill Education