
SWFT Essntl Tax Individ/Bus Entities 2020
23rd Edition
ISBN: 9780357391266
Author: Nellen
Publisher: Cengage
expand_more
expand_more
format_list_bulleted
Related questions
Question
What is Swiss Group's 2018 return on assets?
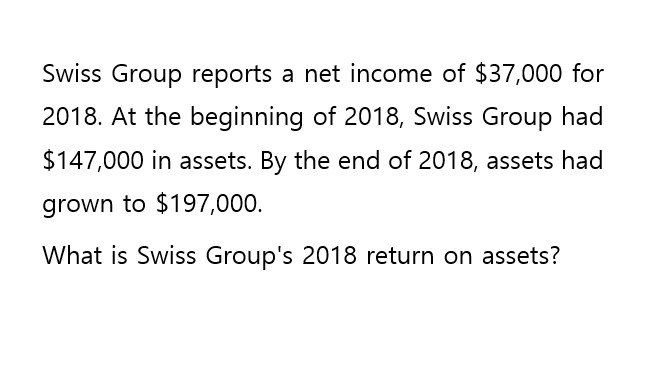

Transcribed Image Text:Swiss Group reports a net income of $37,000 for
2018. At the beginning of 2018, Swiss Group had
$147,000 in assets. By the end of 2018, assets had
grown to $197,000.
What is Swiss Group's 2018 return on assets?
Expert Solution
This question has been solved!
Explore an expertly crafted, step-by-step solution for a thorough understanding of key concepts.

Step by stepSolved in 2 steps

Knowledge Booster

Similar questions
- Swifty Incorporated had average total assets in 2025 of $6343000. It reported sales for of $8209000 that year. Average liabilities for the year were $5187000. Net income for the year was $964136. What is Swifty' return on assets for 2025? O 15.20% 18.59% O 11.74% 6.60%arrow_forwardCoronado Incorporated had average total assets in 2025 of $6345000. It reported sales for of $8217000 that year. Average liabilities for the year were $5199000. Net income for the year was $958095. What is Coronado' return on assets for 2025? O 15.10 % O 18.43% O 6.52% O 11.66%arrow_forwardFinancial information for Powell Panther Corporation is shown below: Powell Panther Corporation: Income Statements for Year Ending December 31 (Millions of Dollars) 2018 2017 Sales $ 1,800.0 $ 1,500.0 Operating costs excluding depreciation and amortization 1,395.0 1,275.0 EBITDA $ 405.0 $ 225.0 Depreciation and amortization 43.0 39.0 Earnings before interest and taxes (EBIT) $ 362.0 $ 186.0 Interest 40.0 33.0 Earnings before taxes (EBT) $ 322.0 $ 153.0 Taxes (40%) 128.8 61.2 Net income $ 193.2 $ 91.8 Common dividends $ 174.0 $ 73.0 Powell Panther Corporation: Balance Sheets as of December 31 (Millions of Dollars) 2018 2017 Assets Cash and equivalents $ 23.0 $ 18.0 Accounts receivable 248.0 225.0 Inventories 396.0 360.0 Total current assets $ 667.0 $ 603.0 Net plant and equipment 429.0 390.0 Total assets $ 1,096.0 $ 993.0 Liabilities and Equity Accounts…arrow_forward
- Financial information for Powell Panther Corporation is shown below: Powell Panther Corporation: Income Statements for Year Ending December 31 (Millions of Dollars) 2018 2017 Sales $ 3,900.0 $ 3,000.0 Operating costs excluding depreciation and amortization 2,925.0 2,550.0 EBITDA $ 975.0 $ 450.0 Depreciation and amortization 90.0 69.0 Earnings before interest and taxes (EBIT) $ 885.0 $ 381.0 Interest 86.0 66.0 Earnings before taxes (EBT) $ 799.0 $ 315.0 Taxes (40%) 319.6 126.0 Net income $ 479.4 $ 189.0 Common dividends $ 431.0 $ 151.0 Powell Panther Corporation: Balance Sheets as of December 31 (Millions of Dollars) 2018 2017 Assets Cash and equivalents $ 38.0 $ 30.0 Accounts receivable 432.0 360.0 Inventories 819.0 630.0 Total current assets $ 1,289.0 $ 1,020.0 Net plant and equipment 897.0 690.0 Total assets $ 2,186.0 $ 1,710.0 Liabilities and Equity…arrow_forwardČardinal Industries had the following operating results for 2018: Sales = $34,621; Cost of goods sold Dividends paid = $2,023. At the beginning of the year, net fixed assets were $19,970, current assets were $7,075, and current liabilities were $4,01O. At the end of the year, net fixed assets were $24,529, current assets were $8,702, and current liabilities were $4,700. The tax rate for 2018 was 25 percent. $24,359; Depreciation expense = $6,027; Interest expense $2,725; %3D a. What is net income for 2018? (Do not round intermediate calculations.) b. What is the operating cash flow for 2018? (Do not round intermediate calculations.) c. What is the cash flow from assets for 2018? (Do not round intermediate calculations. A negative answer should be indicated by a minus sign.) d- If no new debt was issued during the year, what is the cash flow to creditors? (Do not 1. round intermediate calculations.) d- If no new debt was issued during the year, what is the cash flow to stockholders? (Do…arrow_forwardThe comparative statement of financial position for Cullumber Corporation shows the following noncash current asset and liability accounts at March 31: 2018 2017 Accounts receivable $61,000 $43,000 Inventory 70,000 64,000 Accounts payable 35,000 43,000 Dividends payable 1,400 2,300 Cullumber’s income statement reported the following selected information for the year ended March 31, 2018: net income was $280,000, depreciation expense was $60,000, and a loss on the disposal of land was $18,000. Cullumber uses a perpetual inventory system. Calculate net cash provided (used) by operating activities using the indirect method. (Show amounts that decrease cash flow with either a - sign e.g. -15,000 or in parenthesis e.g. (15,000).) CULLUMBER CORPORATIONStatement of Cash Flows (Partial)-Indirect Method Operating activities…arrow_forward
- Computing rate of return on total assets Barot’s 2018 financial statements reported the following items—with 2017 figures given for comparison: Net income for 2018 was $3,910, and interest expense was $240. Compute Barot’s rate of return on total assets for 2018. (Round to the nearest percent.)arrow_forwardThe current sections of Bridgeport Corp.'s balance sheets at December 31, 2016 and 2017, are presented here. Bridgeport Corp.'s net income for 2017 was $153,459. Depreciation expense was $27,081. 2017 2016 Current assets Cash $105,315 $ 99,297 Accounts receivable 80,240 89,267 Inventory 168,504 172,516 Prepaid expenses 27,081 22,066 Total current assets $381,140 $383,146 Current liabilities Accrued expenses payable $ 15,045 $ 5,015 Accounts payable 85,255 92,276 Total current liabilities $100,300 $ 97,291 ember 31, 2017, using Prepare the net cash provided (used) by operating activities section of the company's statement (15,000).) cash flows or the year ende indirect ethod. (Show am that decrease cash flow with either a - sign e.g. -15,000 or in parenthesis e.g. Bridgeport Corp. Partial Statement of Cash Flows $ Adjustments to reconcile net income to $ $1arrow_forwardSuppose the following financial data were reported by 3M Company for 2019 and 2020 (dollars in millions). 3M CompanyBalance Sheets (partial) 2020 2019 Current assets Cash and cash equivalents $3,200 $1,881 Accounts receivable, net 3,500 3,175 Inventories 2,702 3,044 Other current assets 1,896 1,582 Total current assets $11,298 $9,682 Current liabilities $4,791 $5,869 1.Calculate the current ratio and working capital for 3M for 2019 and 2020. 2.Suppose that at the end of 2020, 3M management used $198 million cash to pay off $198 million of accounts payable. How would its current ratio and working capital have changed?arrow_forward
- Suppose the following financial data were reported by 3M Company for 2019 and 2020 (dollars in millions). 3M CompanyBalance Sheets (partial) 2020 2019 Current assets Cash and cash equivalents $3,040 $1,908 Accounts receivable, net 3,370 3,180 Inventories 2,774 3,016 Other current assets 1,956 1,628 Total current assets $11,140 $9,732 Current liabilities $4,882 $5,875 Calculate the current ratio and working capital for 3M for 2019 and 2020.arrow_forwardIf Nixon Corporation had a net income of $420,000 in 2018 and it experienced a 19.8% increase in net income for 2019, what is its net income for 2019?arrow_forwardGeneral Accountingarrow_forward
arrow_back_ios
SEE MORE QUESTIONS
arrow_forward_ios
Recommended textbooks for you
 EBK CONTEMPORARY FINANCIAL MANAGEMENTFinanceISBN:9781337514835Author:MOYERPublisher:CENGAGE LEARNING - CONSIGNMENT
 Cornerstones of Financial AccountingAccountingISBN:9781337690881Author:Jay Rich, Jeff JonesPublisher:Cengage Learning
EBK CONTEMPORARY FINANCIAL MANAGEMENT
Finance
ISBN:9781337514835
Author:MOYER
Publisher:CENGAGE LEARNING - CONSIGNMENT
Cornerstones of Financial Accounting
Accounting
ISBN:9781337690881
Author:Jay Rich, Jeff Jones
Publisher:Cengage Learning