
Practical Management Science
6th Edition
ISBN: 9781337406659
Author: WINSTON, Wayne L.
Publisher: Cengage,
expand_more
expand_more
format_list_bulleted
Related questions
Question
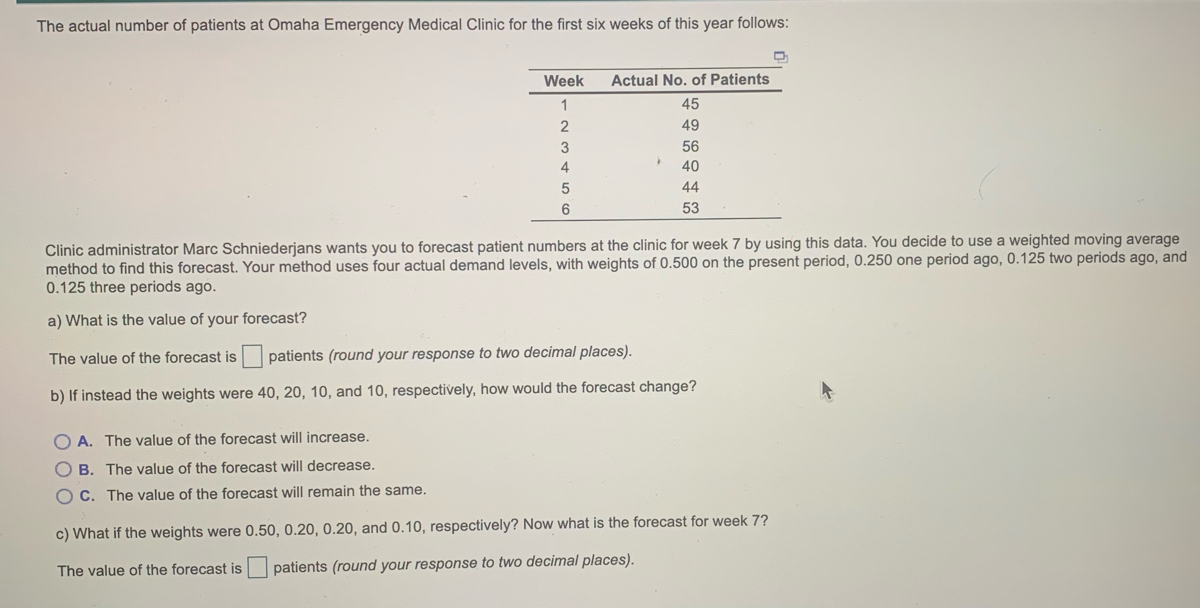

Transcribed Image Text:The actual number of patients at Omaha Emergency Medical Clinic for the first six weeks of this year follows:
Week
Actual No. of Patients
1
45
49
3
56
40
44
53
Clinic administrator Marc Schniederjans wants you to forecast patient numbers at the clinic for week 7 by using this data. You decide to use a weighted moving average
method to find this forecast. Your method uses four actual demand levels, with weights of 0.500 on the present period, 0.250 one period ago, 0.125 two periods ago, and
0.125 three periods ago.
a) What is the value of your forecast?
The value of the forecast is patients (round your response to two decimal places).
b) If instead the weights were 40, 20, 10, and 10, respectively, how would the forecast change?
O A. The value of the forecast will increase.
O B. The value of the forecast will decrease.
C. The value of the forecast will remain the same.
c) What if the weights were 0.50, 0.20, 0.20, and 0.10, respectively? Now what is the forecast for week 7?
The value of the forecast is patients (round your response to two decimal places).
Expert Solution
This question has been solved!
Explore an expertly crafted, step-by-step solution for a thorough understanding of key concepts.

This is a popular solution

Trending nowThis is a popular solution!

Step by stepSolved in 2 steps with 2 images

Knowledge Booster

Similar questions
- The sale of cycles in a shop in three consecutive months are given as 70, 68 and 82 units respectively. Exponential smoothing method with a smoothing constant of 0.4 is used in forecasting. Assume the forecast for the first month is 70 units. The expected number of sales (round off to the nearest whole number) in the 4thmonth is: a. 66 units. b. 71 units. c. 76 units. d. 81 units.arrow_forwardUse exponential smoothing with trend adjustment to forecast demand for period 11. Let α = 0.5, � = 0.3, and let the initial trend value be 12 and the initial forecast be 200arrow_forwardThe actual number of patients at Providence Emergency Medical Clinic for the first six weeks of this year follows: The value of the forecast is Week Actual No. of Patients 45 49 IT 56 40 44 55 Clinic administrator Dana Schniederjans wants you to forecast patient numbers at the clinic for week 7 by using this data. You decide to use a weighted moving average method to find this forecast. Your method uses four actual demand levels, with weights of 0.333 on the present period, 0.250 one period ago, 0.250 two periods ago, and 0.167 three periods ago. a) What is the value of your forecast? patients (round your response to two decimal places). 123456arrow_forward
- The following table shows predicted product demand using your particular forecasting method along with the actual demand that occurred: FORECAST ACTUAL 1,480 1,530 1,380 1,480 1,680 1,580 1,730 1,780 1,630 1,680 Compute the tracking signal using the mean absolute deviation and running sum of forecast errors. Note: Negative values should be indicated by a minus sign. Round your "Mean Absolute Deviation", "Tracking Signal" to 2 decimal places and all other answers to the nearest whole number. Period Forecast Actual Deviation RSFE Absolute Deviation Sum of Absolute MAD TS Deviation 1 1,480 1,530 -50 -50 50 50 50.00 -1.00 2 1,380 1,480 -100 -150 100 150 75.00 -2.00 3 1,680 1,580 100 -50 100 250 83.33 -0.60 4 1,730 1,630 100 50 100 350 87.50 0.57 5 1,780 1,680 100 150 100 450 90.00 1.67arrow_forwardA police station had to deploy a police officer for an emergency multiple times in the last four evenings. The table below shows the number of emergencies each evening. Weekday Number of calls each day Monday 9:48 Tuesday 3 Wednesday 8 Thursday 11 (Round your answer to 1 decimal place.) What would be their forecast for the emergencies on Friday using a two-day moving average approach? Forecast for Friday callsarrow_forwardGiven is a historical time series for job services demand in the prior 6 months. Month 1 2 3 4 5 6 Demand 799 816 789 814 815 805 The Period 6 forecast by using weighted moving average with weights of 0.05, 0.25, 0.40, and 0.30 = Blank 1 (in 2 decimal places)arrow_forward
- The demand data for Double T Computer Services appears below. The company wants you to forecast the demand for period 4. What is your forecast using the least squares method? Period Demand 1 37 2 40 3 40arrow_forwardGiven an actual demand this period of 90, a forecast for this period of 58, and an alpha of 0.2, what would the forecast for the next period be using exponential smoothing?arrow_forwardThe worksheet Hudson Demand Case Data in MindTap provides the number of visits over one year from January to December (52 weeks). Chart the data and explain the characteristics of the time series. How would you forecast future demand for customer visits? What criteria will you use to determine a “good” forecast? What methods would you use, and why? What is your final recommendation with respect to a forecasting method? Note:- Do not provide handwritten solution. Maintain accuracy and quality in your answer. Take care of plagiarism. Answer completely. You will get up vote for sure.arrow_forward
- The following table shows the actual demand observed over the last 11 years: Year 1 2 3 4 5 6 7 8 9 10 11 Demand 6 8 4 7 11 7 13 12 10 13 8 This exercise contains only parts b, c, and d. Part 2 b) Using the 3-year moving average, provide the forecast from periods 4 through 12 (round your responses to one decimal place). Part 3 c) Using the 3-year weighted moving average with weights 0.10, 0.30, and 0.60, using 0.60 for the most recent period, provide the forecast from periods 4 through 12 (round your responses to two decimal places). Part 4 d) Mean absolute deviation for the forecast developed…arrow_forwardThe number of cans of soft drinks sold in a machine each week is recorded below. Develop forecasts for the period indicated and error calculations. 155, 145, 155, 162, 180, 165, 172, 149, 170, 172 Exponential smoothing. Use Excel Solver to determine the optimum alpha value to minimize MSE and answer: What is the Mean Absolute Percentage Error (MAPE)?arrow_forwardElna inc is a microwave manufacturing and distribution company based in Jakarta. The company needs to estimate production demand using the historical sales data of the last 24 months (periods).A logistics manager of the company then uses the moving average, exponential smoothing, and simple linear regression methods to determine sales forecasts for the next 12 months (Graphically illustrate the results). Provide an analysis and the results of bias, MAPE, MSE, and MAD for the forecasting decisions.Moving average is 4 month, and alfa is 0.05arrow_forward
arrow_back_ios
SEE MORE QUESTIONS
arrow_forward_ios
Recommended textbooks for you
- Practical Management ScienceOperations ManagementISBN:9781337406659Author:WINSTON, Wayne L.Publisher:Cengage,
 Operations ManagementOperations ManagementISBN:9781259667473Author:William J StevensonPublisher:McGraw-Hill Education
 Operations and Supply Chain Management (Mcgraw-hi...Operations ManagementISBN:9781259666100Author:F. Robert Jacobs, Richard B ChasePublisher:McGraw-Hill Education
 Purchasing and Supply Chain ManagementOperations ManagementISBN:9781285869681Author:Robert M. Monczka, Robert B. Handfield, Larry C. Giunipero, James L. PattersonPublisher:Cengage Learning
 Production and Operations Analysis, Seventh Editi...Operations ManagementISBN:9781478623069Author:Steven Nahmias, Tava Lennon OlsenPublisher:Waveland Press, Inc.
Practical Management Science
Operations Management
ISBN:9781337406659
Author:WINSTON, Wayne L.
Publisher:Cengage,
Operations Management
Operations Management
ISBN:9781259667473
Author:William J Stevenson
Publisher:McGraw-Hill Education
Operations and Supply Chain Management (Mcgraw-hi...
Operations Management
ISBN:9781259666100
Author:F. Robert Jacobs, Richard B Chase
Publisher:McGraw-Hill Education
Purchasing and Supply Chain Management
Operations Management
ISBN:9781285869681
Author:Robert M. Monczka, Robert B. Handfield, Larry C. Giunipero, James L. Patterson
Publisher:Cengage Learning
Production and Operations Analysis, Seventh Editi...
Operations Management
ISBN:9781478623069
Author:Steven Nahmias, Tava Lennon Olsen
Publisher:Waveland Press, Inc.