Return on assets
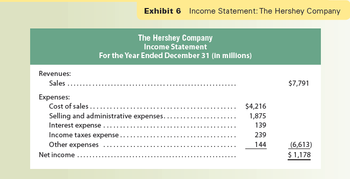
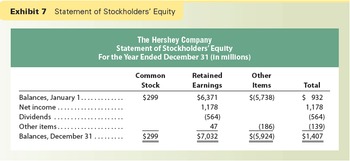
The financial statements of The Hershey Company (HSY) are shown in Exhibits 6 through 9. Based upon these statements, answer the following questions.
1. What are Hershey's sales (in millions)?
2. What is Hershey's cost of sales (in millions)?
3. What is Hershey's net income (in millions)?
4. What is Hershey's percent of the cost of the sales to sales? Round to one decimal place.
5. The percent that a company adds to its cost of sales to determine the selling price is called a markup. What is Hershey's markup percent? Round to one decimal place.
6. What is the percentage of net income to sales for Hershey? Round to one decimal place.
7. Hershey had total assets of $5,554 (millions) at the beginning of the year. Compute the return on assets for Hershey for the year shown in Exhibits 6–9. Round to one decimal place.


Trending nowThis is a popular solution!
Step by stepSolved in 4 steps

- Can you please match the correct term to the defarrow_forwardWhat is the operating income and the net income?arrow_forwardSome recent financial statements for Smolira Golf, Incorporated, follow. Assets Current assets Cash Accounts receivable Inventory Total Fixed assets Net plant and equipment Total assets Sales Cost of goods sold Depreciation EBIT Interest paid Taxable income Taxes SMOLIRA GOLF, INCORPORATED 2022 Income Statement Net income Dividends Retained earnings 2021 Short-term solvency ratios a. Current ratio b. Quick ratio c. Cash ratio Asset utilization ratios d. Total asset turnover e. Inventory turnover f. Receivables turnover Long-term solvency ratios g. Total debt ratio h. Debt-equity ratio i. Equity multiplier j. Times interest earned ratio k. Cash coverage ratio Profitability ratios I. Profit margin m. Return on assets n. Return on equity $3,061 4,742 12,578 $ 20,381 SMOLIRA GOLF, INCORPORATED Balance Sheets as of December 31, 2021 and 2022 2022 Liabilities and Owners' Equity Current liabilities Accounts payable Notes payable Other $ 52,746 $ 73,127 2021 $ 188,370 126, 703 5,283 $ 56,384…arrow_forward
- Question Content Area Use the information provided for Harding Company to answer the question that follow. Harding Company Accounts payable $31,654 Accounts receivable 69,987 Accrued liabilities 6,524 Cash 16,364 Intangible assets 38,210 Inventory 80,832 Long-term investments 90,451 Long-term liabilities 73,398 Notes payable (short-term) 26,425 Property, plant, and equipment 659,739 Prepaid expenses 1,697 Temporary investments 38,252 Based on the data for Harding Company, what is the amount of quick assets?arrow_forwardConsider the following balance sheet and income statement for Mmm Good Foods Incorporated (the company that operates Tasty Fried Chicken and Pizza Party), in condensed form, including some information from the cash flow statement: (amounts are in millions) Balance Sheet Cash and short-term Investments Accounts receivable Inventory Other current assets Long-lived assets Total assets Current liabilities Total liabilities Noncontrolling interest Shareholders equity Total liabilities and equity Income Statement. Sales Cost of sales Gross margin Earnings before interest and taxes Interest Taxes Income from discontinued operations Net income. Share price Earnings per share. Number of outstanding shares (millions) Cash Flows Cash flow from operations Capital expenditures Dividends Mmm Good Foods Incorporated 2019 $ 716 382 48 432 4,068 $5,646 $1,429 11,158 (5,512) $5,646 $ 6,486 3,558 $ 2,928 $1,637 319 336 613 $1,595 $75 5.31 356.2 $1,216 416 754arrow_forwardWhat's the total asset turnover ratio of this company? Assets: Cash and marketable securities Accounts receivable Inventories Prepaid expenses Total current assets Fixed assets Less: accum. depr. Net fixed assets Total assets Liabilities: Accounts payable Notes payable Accrued taxes Total current liabilities Long-term debt Owner's equity (1 million shares of common stock outstanding) Total liabilities and owner's equity Net sales (all credit) Less: Cost of goods sold Selling and administrative expense Depreciation expense Interest expense Earnings before taxes Income taxes Net income 1.41 2.33 O 4.45 1.11 8,000,000 (2,075,000) $600,000 900,000 1,500,000 75,000 $3,075,000 $5,925.000 $9,000,000 $800,000 700,000 50,000 $1,550,000 2,500,000 4,950,000 $9,000,000 $10,000,000 (3,000,000) (2,000,000) (250,000) (200,000) 4,550,000 (1,820,000) $2,730,000arrow_forward
- Some recent financial statements for Smolira Golf Corporation follow. Assets Current assets Cash Accounts receivable Inventory Total Total assets Fixed assets Net plant and equipment $336,695 Sales Cost of goods sold Depreciation Taxable income Taxes (22%) Net income SMOLIRA GOLF CORPORATION 2021 Income Statement Earnings before interest and taxes Interest paid Dividends Retained earnings a. Current ratio b. Quick ratio c. Cash ratio Short-term solvency ratios: Asset utilization ratios: d. Total asset turnover e. Inventory tumover 1. Receivables turnover 2020 $23,066 $25,300 13,648 16,400 27,152 28,300 $63,866 $70,000 g. Total debt ratio h. Debt-equity ratio I. Equity multiplier Long-term solvency ratios: Times Interest emned K Cash coverage ratio Profitability ratios: SMOLIRA GOLF CORPORATION 2020 and 2021 Balance Sheets 2021 $ 400,561 $ 434,000 1. Profit margin m. Return on assels n. Return on equity $ 364,000 $ 22,000 19,891 Find the following financial ratios for Smolira Golf…arrow_forwardPlease calculate the Gross profit percentage, current ratio, debt-to-equity ratio, and earnings per share for Columbia Sportswear Company. Using the ratios, evaluate the financial statements from Columbia Sportswear Company. What does each of your four ratios indicate about the financial performance of the company? Based on your financial analysis: would you invest in this company? Why or why not?arrow_forwardWhich of the following ratios would a lender find most useful in monitoring a borrower's ability to make loan payments? () PE ratio Return on assets Total asset turnover Inventory turnover () Cash coverage ratio Previous Page Next Page Page 6arrow_forward
- Subject - account Please help me. Thankyou.arrow_forwardFollowing this balance sheet of chevron's company, provide me with a horizontal analysis comparative balance sheets.arrow_forwardShow the computation of Cash-Flow from Assets and how this Cash-Flow is distributed to Debtholders (or Creditors) and Stockholders.arrow_forward

 AccountingAccountingISBN:9781337272094Author:WARREN, Carl S., Reeve, James M., Duchac, Jonathan E.Publisher:Cengage Learning,
 Accounting Information SystemsAccountingISBN:9781337619202Author:Hall, James A.Publisher:Cengage Learning,
 Horngren's Cost Accounting: A Managerial Emphasis...AccountingISBN:9780134475585Author:Srikant M. Datar, Madhav V. RajanPublisher:PEARSON
 Intermediate AccountingAccountingISBN:9781259722660Author:J. David Spiceland, Mark W. Nelson, Wayne M ThomasPublisher:McGraw-Hill Education
 Financial and Managerial AccountingAccountingISBN:9781259726705Author:John J Wild, Ken W. Shaw, Barbara Chiappetta Fundamental Accounting PrinciplesPublisher:McGraw-Hill Education


