FINANCIAL ACCOUNTING
10th Edition
ISBN: 9781259964947
Author: Libby
Publisher: MCG
expand_more
expand_more
format_list_bulleted
Question
None

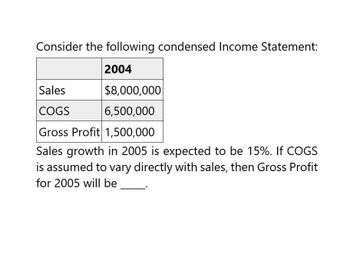
Transcribed Image Text:Consider the following condensed Income Statement:
2004
Sales
COGS
$8,000,000
6,500,000
Gross Profit 1,500,000
Sales growth in 2005 is expected to be 15%. If COGS
is assumed to vary directly with sales, then Gross Profit
for 2005 will be
Expert Solution
This question has been solved!
Explore an expertly crafted, step-by-step solution for a thorough understanding of key concepts.
Step by stepSolved in 2 steps

Knowledge Booster
Similar questions
- Answerarrow_forwardConsider the following information that you propose to use to obtain an estimate of year 2004 EPS for the MacLog Company. Estimated Year 2019 Year 2020 GDP 11,000 Billion GDP growth 3.5% Sales per share $800 Operating profit margin 12% Depreciation/Fixed Assets 14% Fixed asset turnover 2 Interest rate 3.5% Total asset turnover 0.7 Debt/Total assets 45% Tax rate 36% In addition, a regression analysis indicates the following relationship between growth in sales per share for MacLog, and GDP growth is %Δ Sales per share = 0.015 + 0.75(%Δ GDP) Refer to Exhibit 9.6. Calculate the firm's level of Total Assets per share for the year 2020. a. $1,385.77 b. $1,113.58 c. $1,050.65 d. $1,065.67 e. $1,190.06arrow_forwardon the pro forma income statement sales are expected to increase by 23%. If the net margin is expected to increase by 18% and net profit last year was 100 million, what is the net profit projected to be? A) 118 million. B)123 million. C )158 million D) 141 millionarrow_forward
- Solutionarrow_forwardForecast the next year Income Statement using the base year and growth rates. Use all formulas, not numbers. Sales Cost of Sales Gross Margin Operating Expenses R&D Operating Profit Interest Expense Income before taxes Income Taxes Net Income Base Year Forecast Growth rate 100 888898 50 50 20 10 20 4 16 4 12 20% 15% 15% 25% 100% 25% RATEarrow_forwardThe following partial income statement data pertains to Tatum Toy Company's recent year completed and its forecast for the coming year (in millions): Recent $875.00 Sales Operating costs EBIT Interest expense EBT What was the expected percentage change in sales? a. 20% b. 16% c. -20% d. 55% e. 83% 625.00 $250.00 50.00 $200.00 Projected $1,050.00 682.50 $367.50 50.00 $317.50arrow_forward
- Suppose a firm has had the following historic sales figures. What would be the forecast for next year's sales using the average approach? Year: 2009 2010 2011 2012 2013 Sales $1,500,000 $1,750,000 $1,400,000 $2,000,000 $1,600,000arrow_forwardSuppose a firm has had the following historic sales figures. Year: 2009 2010 2011 2012 2013 Sales $3,300,000 $3,550,000 $3,200,000 $3,800,000 $3,400,000 What would be the forecast for next year's sales using the average approach? Next year's salesarrow_forwardSuppose a firm has had the following historic sales figures. Year: 2009 2010 2011 2012 2013 Sales $1,420,000 $1,720,000 $1,600,000 $2,010,000 $1,770,000 What would be the forecast for next year's sales using regression to estimate a trend? Next year's salesarrow_forward
- Use the table for the question(s) below. FCF Forecast ($ million) Year Sales 1 270 12.5% 32.40 Less: Income Tax (37%) (6.48) Less Increase in NWC (12% of Change in Sales) 3,60 Free Cash Flow 22.32 Growth versus Prior Year EBIT (10% of Sales) 0 240 OA. $4.27 OB. $7.47 OC. $12.8 OD. $5.12 2 290 7.4% 34.80 (6.96) 2.40 25.44 ACCE 3 310 6.9% 37.20 (7.44) 2.40 27.36 Banco Industries expect sales to grow at a rapid rate over the next 3 years, but settle to an industry growth rate of 4% in year 4. The spreadsheet above shows a simplified pro forma for Banco Industries. Banco industries has a weighted average cost of capital of 10%, $30 million in cash, $60 million in debt, and 18 million shares outstanding. If Banco Industries can reduce its operating expenses so that EBIT becomes 12% of sales, by how much will its stock price increase? 4 325.5 5.0% 39.06 (7.81) 1.86 29.388arrow_forwardAssume the following sales data for a company:Current year$832,402 Preceding year608,082What is the percentage increase in sales from the preceding year to the current year? a.136.89% b.36.89% c.73.05% d.26.95% The relationship of $242,729 to $104,267, expressed as a ratio, is a.0.8 b.2.3 c.0.4 d.0.7arrow_forwardAssume the following sales data for a company: Current year $1,025,000 Preceding year 820,000 What is the percentage increase in sales from the preceding year to the current year?arrow_forward
arrow_back_ios
SEE MORE QUESTIONS
arrow_forward_ios
Recommended textbooks for you

 AccountingAccountingISBN:9781337272094Author:WARREN, Carl S., Reeve, James M., Duchac, Jonathan E.Publisher:Cengage Learning,
 Accounting Information SystemsAccountingISBN:9781337619202Author:Hall, James A.Publisher:Cengage Learning,
 Horngren's Cost Accounting: A Managerial Emphasis...AccountingISBN:9780134475585Author:Srikant M. Datar, Madhav V. RajanPublisher:PEARSON
 Intermediate AccountingAccountingISBN:9781259722660Author:J. David Spiceland, Mark W. Nelson, Wayne M ThomasPublisher:McGraw-Hill Education
 Financial and Managerial AccountingAccountingISBN:9781259726705Author:John J Wild, Ken W. Shaw, Barbara Chiappetta Fundamental Accounting PrinciplesPublisher:McGraw-Hill Education


Accounting
Accounting
ISBN:9781337272094
Author:WARREN, Carl S., Reeve, James M., Duchac, Jonathan E.
Publisher:Cengage Learning,

Accounting Information Systems
Accounting
ISBN:9781337619202
Author:Hall, James A.
Publisher:Cengage Learning,

Horngren's Cost Accounting: A Managerial Emphasis...
Accounting
ISBN:9780134475585
Author:Srikant M. Datar, Madhav V. Rajan
Publisher:PEARSON

Intermediate Accounting
Accounting
ISBN:9781259722660
Author:J. David Spiceland, Mark W. Nelson, Wayne M Thomas
Publisher:McGraw-Hill Education

Financial and Managerial Accounting
Accounting
ISBN:9781259726705
Author:John J Wild, Ken W. Shaw, Barbara Chiappetta Fundamental Accounting Principles
Publisher:McGraw-Hill Education