Entrepreneurial Finance
6th Edition
ISBN: 9781337635653
Author: Leach
Publisher: Cengage
expand_more
expand_more
format_list_bulleted
Question
Answer

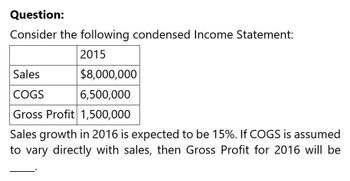
Transcribed Image Text:Question:
Consider the following condensed Income Statement:
2015
Sales
COGS
$8,000,000
6,500,000
Gross Profit 1,500,000
Sales growth in 2016 is expected to be 15%. If COGS is assumed
to vary directly with sales, then Gross Profit for 2016 will be
Expert Solution
This question has been solved!
Explore an expertly crafted, step-by-step solution for a thorough understanding of key concepts.
Step by stepSolved in 2 steps

Knowledge Booster
Similar questions
- Suppose a firm has had the following historic sales figures. What would be the forecast for next year's sales using the average approach? Year: 2009 2010 2011 2012 2013 Sales $1,500,000 $1,750,000 $1,400,000 $2,000,000 $1,600,000arrow_forwardGiven the income statement below, Mega Trade Inc. wants to find the resulting net income for the year 2018 (in million). What is the right amount? Income Statement ($ Million) Year End 2015 2016 2017 2018 Sales 1,234.90 1,251.70 1,300.40 1,334.40 Cost of Sales -679.1 -659 -681.3 -667 Selling & Administration -339.7 -348.6 -351.2 -373.3 Depreciation -47.5 -52 -55.9 -75.2 Other Income/Expenses 11.8 7.6 7 8.2 Interest Income 1.3 1.4 1.7 2 Interest Expense -16.2 -15.1 -20.5 -23.7 Income Taxes -56.8 -64.2 -67.5 -72.6 Dividends -38.3 -38.7 -39.8 -40.1 CHOICES: A. 108.7B. 132.7C. No choice givenD. 132.8E. 121.8arrow_forwardSuppose a firm has had the following historic sales figures. Year: 2009 2010 2011 2012 2013 Sales $3,300,000 $3,550,000 $3,200,000 $3,800,000 $3,400,000 What would be the forecast for next year's sales using the average approach? Next year's salesarrow_forward
- Calculate Sales Revenue for Company XYZ Ltd for 2016; if Market Demand = 18 million, XYZ's Market Share 12%, Average Selling Price = $15: $32.4 million $30 million. $22.5 million O $27 millionarrow_forwardKyle Company had the following information pertaining to 2022:Profit P100,000Sales P1,000,000Asset Turnover ratio 2 timesThe desired minimum rate of return is 15 percent. Questions: 1. What is the Return on Sales? 2. What is the ROI? 3. What is the amount of assets?arrow_forwardWhat is the sustainable growth rate for 2015? Narrow Falls Lumber 2015 Income Statement Net sales Cost of goods sold Depreciation EBIT Interest Taxable income Taxes Net income Dividends Cash Accounts receivable Inventory Net fixed assets Total assets Select one: a. 10.91% b. 14.46% c. 15.54% d. 12.63% e. 13.97% $28,200 $848,600 542,800 147,400 $158,400 12,600 $145,800 51,800 $94.000 Narrow Falls Lumber Balance Sheets as of December 31, 2014 and 2015 2015 2014 $ 32,300 $ 26,900 74,700 72,300 99,500 97,800 707,100 705,000 $913.600 $902,000 Accounts payable Notes payable Long-term debt Common stock and paid-in surplus ($1 par value) Retained earnings Total liabilities & owners' equity 2015 2014 $ 78,900 $ 79,200 40,000 354,500 50,000 295,600 170,000 175,000 319.100 253,300 $913.600 $902,000arrow_forward
- Suppose a firm has had the following historic sales figures. Year: 2009 2010 2011 2012 2013 Sales $1,420,000 $1,720,000 $1,600,000 $2,010,000 $1,770,000 What would be the forecast for next year's sales using regression to estimate a trend? Next year's salesarrow_forwardForecast the next year Income Statement using the base year and growth rates. Use all formulas, not numbers. Sales Cost of Sales Gross Margin Operating Expenses R&D Operating Profit Interest Expense Income before taxes Income Taxes Net Income Base Year Forecast Growth rate 100 888898 50 50 20 10 20 4 16 4 12 20% 15% 15% 25% 100% 25% RATEarrow_forwardIn the income statement below, ABC Trade Inc. wants to find the resulting net income for the year 2018 (in million). What is the right amount? Income Statement ($ Million) Year End 2015 2016 2017 2018 Sales 1,234.90 1,251.70 1,300.40 1,334.40 Cost of Sales (679.10) (659.00) (681.30) (667.00) Gross Operating Income Selling & Administration (339.70) (348.60) (351.20) (373.30) Depreciation (47.50) (52.00) (55.90) (75.20) Other Income/Expenses 11.80 7.60 7.00 8.20 Earnings Before Interest and Taxes Interest Income 1.30 1.40 1.70 2.00 Interest Expense (16.20) (15.10) (20.50) (23.70) Pre Tax Income Income Taxes (56.80) (64.20) (67.50) (72.60) Net Income Dividends (38.30) (38.70) (39.80) (40.10) Addition to Retained Earnings Group of answer choices 121.8 108.7 132.7 132.8 No choice givenarrow_forward
- b. By what percentage did the net income grow each year? For example, revenues (increased or decreased) in 2013 x 10.02% however, cost of goods sold (declined or increased) by 7.70%. *Use the Data Table*arrow_forwardquestion: how much is the forcasted fixed expenses amount for 2015 is expected to be?arrow_forwardNeed detailed help with the proforma income statementarrow_forward
arrow_back_ios
SEE MORE QUESTIONS
arrow_forward_ios
Recommended textbooks for you
