
FINANCIAL ACCOUNTING
10th Edition
ISBN: 9781259964947
Author: Libby
Publisher: MCG
expand_more
expand_more
format_list_bulleted
Related questions
Question
Computing the cash ratio
Smythe Banners reported the Following figures in its financial statements:
Compute the cash ratio for Smythe Banners.
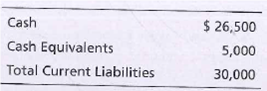

Transcribed Image Text:Cash
Cash Equivalents
$ 26,500
5,000
Total Current Liabilities
30,000
Expert Solution
This question has been solved!
Explore an expertly crafted, step-by-step solution for a thorough understanding of key concepts.

This is a popular solution

Trending nowThis is a popular solution!

Step by stepSolved in 2 steps

Knowledge Booster


Learn more about
Need a deep-dive on the concept behind this application? Look no further. Learn more about this topic, accounting and related others by exploring similar questions and additional content below.Similar questions
- Subject:arrow_forwardRequired information [The following information applies to the questions displayed below.] Consider the following balance sheet and income statement for Mmm Good Foods Incorporated (the company that operates Tasty Fried Chicken and Pizza Party), in condensed form, including some information from the cash flow statement: (amounts are millions) Balance Sheet Cash and short-term investments Accounts receivable Inventory Other current assets Long-lived assets Total assets Current liabilities Total liabilities Shareholders' equity Total liabilities and equity Income Statement Sales Cost of sales Gross margin Earnings before interest and taxes Interest Taxes Net income Share price Earnings per share Number of outstanding shares (millions) Cash Flows Cash flow from operations Capital expenditures Dividends Mmm Good Foods Incorporated 2019 2018 $743 623 $ 443 597 161 3,704 $ 5,231 $ 1,541 13, 247 (8,016) $ 5,231 $ 5,597 1,235 $ 4,362 $ 1,859 486 79 $ 1,294 $ 102 4.23 300 $ 1,315 196 511 167…arrow_forwardGolden Corporation's current year income statement, comparative balance sheets, and additional information follow. For the year, (1) all sales are credit sales, (2) all credits to Accounts Receivable reflect cash receipts from customers, (3) all purchases of inventory are on credit, (4) all debits to Accounts Payable reflect cash payments for inventory, and (5) any change in Income Taxes Payable reflects the accrual and cash payment of taxes. GOLDEN CORPORATION Comparative Balance Sheets December 31 Current Year Prior Year Assets Cash $ 171,000 $ 114,700 Accounts receivable 93,500 78,000 Inventory 611,500 533,000 Total current assets 876,000 725,700 Equipment 353,800 306,000 Accumulated depreciation—Equipment (161,500) (107,500) Total assets $ 1,068,300 $ 924,200 Liabilities and Equity Accounts payable $ 101,000 $ 78,000 Income taxes payable 35,000 28,600 Total current liabilities 136,000 106,600 Equity Common stock, $2 par value…arrow_forward
- The following information is available for Davis Company and Bender Inc.: Account Cash Cash equivalents Current notes receivable Accounts receivable Prepaid expenses Inventory Fixed assets Accumulated depreciation-Fixed assets Accounts payable Current accrued liabilities Mortgage payable Equity Total Davis Company Dr. $321 88 56 603 55 714 920 $2,757 Davis Company Cr. $415 260 213 917 952 $2,757 Bender Inc. Dr. $425 95 46 307 85 898 755 $2,611 a. Compute the quick ratio for each company. Round ratios to two decimal places. Bender Inc. Cr. $225 198 149 824 1,215 $2,611arrow_forwardEvaluate and comment on businesses financial performance by calculating and analysing 2 profitability, liquidity and solvency ratios based on the information from financial statements Consider whether certain aspects (profitability, liquidity or solvency) can be improved and if so, how? (300 words)arrow_forwardB Net sales Cost of goods sold Selling and administrative expenses Interest expense Other income (expense) Income tax expense Net income Current assets. Noncurrent assets Total assets Current liabilities Long-term debt Total stockholders' equity Total liabilities and stockholders' equity Total assets Total stockholders' equity Current liabilities Total liabilities Average net accounts receivable Average inventory Net cash provided by operating activities Capital expenditures Cash dividends paid 1. 2. 3. 4. 5. 6. 7. 8. 9. 10. 11. 12. Ratio Current ratio Accounts receivable turnover Average collection period Inventory turnover Days in inventory Profit margin Asset turnover Return on assets Debt to assets ratio Walmart Inc. Income Statement Data for Year Times interest earned Target Corporation Return on common stockholders' equity Free cash flow $66,900 44,000 14,400 750 (95) 1,500 $6,155 $17,000 26,800 $43,800 Balance Sheet Data (End of Year) $10,000 17,300 16,500 $43,800 13,400 10,000…arrow_forward
- The following information pertains to Diane Company. Assume that all balance sheet amounts represent both average and ending balance figures and that all sales were on credit. Use this information to answer the question that follow. Assets Cash and short-term investments $39,569 Accounts receivable (net) 29,417 Merchandise inventory 30,907 Property, plant, and equipment 219,211 Total assets $319,104 Liabilities and Stockholders' Equity Current liabilities $66,051 Long-term liabilities 93,607 Stockholders' equity—common 159,446 Total liabilities and stockholders' equity $319,104 Income Statement Sales $93,952 Cost of merchandise sold (37,581) Gross profit $56,371 Operating expenses (26,268) Interest expense (4,698) Net income $25,405 Number of shares of common stock outstanding 6,014 Market price per share of common stock $31 Total dividends paid $8,800 Net cash flows from operating activities…arrow_forwardoped Dok H Int 0 ence [The following information applies to the questions displayed below] Forten Company's current year Income statement, comparative balance sheets, and additional Information follow. For the year. (1) all sales are credit sales, (2) all credits to Accounts Receivable reflect cash receipts from customers, (3) all purchases of Inventory are on credit, and (4) all debits to Accounts Payable reflect Sens cash payments for Inventory. FORTEN COMPANY Income Statement For Current Year Ended December 31 Sales Cost of goods sold Gross profit Operating expenses (excluding depreciation) Depreciation expense Other gains (losses) Loss on sale of equipment Income before taxes Income taxes expense Net income Assets Cash FORTEN COMPANY Comparative Balance Sheets December 31 Accounts receivable Inventory Prepaid expenses Total current assets Equipment Accumulated depreciation-Equipment Total assets Liabilities and Equity Accounts payable Long-term notes payable Total liabilities…arrow_forwardWhich financial statement would show the revenues of the company for the year? Group of answer choices Statement of Shareholders' Equity Income Statement Balance Sheet Statement of Cash Flowsarrow_forward
- ans in txt formarrow_forwardi need the answer quicklyarrow_forwardD&D Company reports select items from its statement of cash flows. Identify those items related to investing activities and co- net cash flows from investing activities. Activity Cash paid to purchase property Cash from selling merchandise Cash paid for income taxes Cash received from a long-term note Cash paid to repurchase stock Cash received from sale of investments Cash received from issuing equity shares Cash paid to purchase merchandise Cash paid to purchase investment securities Cash paid in salaries and wages Note: Cash outflows should be indicated by a minus sign. Activity Net cash flows from investing activities $ Amount 0 Amount $ 400,000 688,000 135,000 850,000 100,000 40,000 500,000 710,000 50,000 410,000arrow_forward
arrow_back_ios
SEE MORE QUESTIONS
arrow_forward_ios
Recommended textbooks for you
 AccountingAccountingISBN:9781337272094Author:WARREN, Carl S., Reeve, James M., Duchac, Jonathan E.Publisher:Cengage Learning,
 Accounting Information SystemsAccountingISBN:9781337619202Author:Hall, James A.Publisher:Cengage Learning,
 Horngren's Cost Accounting: A Managerial Emphasis...AccountingISBN:9780134475585Author:Srikant M. Datar, Madhav V. RajanPublisher:PEARSON
 Intermediate AccountingAccountingISBN:9781259722660Author:J. David Spiceland, Mark W. Nelson, Wayne M ThomasPublisher:McGraw-Hill Education
 Financial and Managerial AccountingAccountingISBN:9781259726705Author:John J Wild, Ken W. Shaw, Barbara Chiappetta Fundamental Accounting PrinciplesPublisher:McGraw-Hill Education
Accounting
Accounting
ISBN:9781337272094
Author:WARREN, Carl S., Reeve, James M., Duchac, Jonathan E.
Publisher:Cengage Learning,
Accounting Information Systems
Accounting
ISBN:9781337619202
Author:Hall, James A.
Publisher:Cengage Learning,
Horngren's Cost Accounting: A Managerial Emphasis...
Accounting
ISBN:9780134475585
Author:Srikant M. Datar, Madhav V. Rajan
Publisher:PEARSON
Intermediate Accounting
Accounting
ISBN:9781259722660
Author:J. David Spiceland, Mark W. Nelson, Wayne M Thomas
Publisher:McGraw-Hill Education
Financial and Managerial Accounting
Accounting
ISBN:9781259726705
Author:John J Wild, Ken W. Shaw, Barbara Chiappetta Fundamental Accounting Principles
Publisher:McGraw-Hill Education