Essentials Of Investments
11th Edition
ISBN: 9781260013924
Author: Bodie, Zvi, Kane, Alex, MARCUS, Alan J.
Publisher: Mcgraw-hill Education,
expand_more
expand_more
format_list_bulleted
Question
thumb_up100%

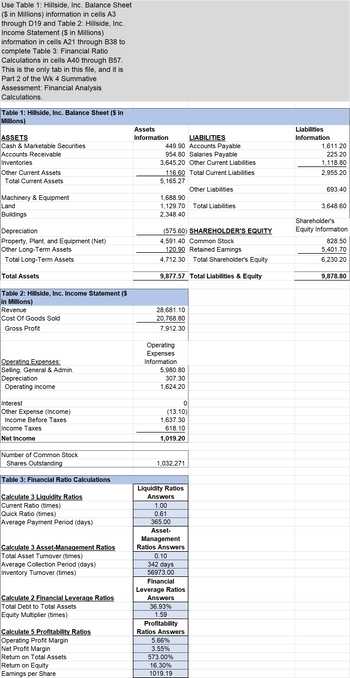
Transcribed Image Text:Use Table 1: Hillside, Inc. Balance Sheet
($ in Millions) information in cells A3
through D19 and Table 2: Hillside, Inc.
Income Statement ($ in Millions)
information in cells A21 through B38 to
complete Table 3: Financial Ratio
Calculations in cells A40 through B57.
This is the only tab in this file, and it is
Part 2 of the Wk 4 Summative
Assessment: Financial Analysis
Calculations.
Table 1: Hillside, Inc. Balance Sheet ($ in
Millions)
ASSETS
Cash & Marketable Securities
Accounts Receivable
Inventories
Other Current Assets
Total Current Assets
Machinery & Equipment
Land
Buildings
Depreciation
Property, Plant, and Equipment (Net)
Other Long-Term Assets
Total Long-Term Assets
Total Assets
Table 2: Hillside, Inc. Income Statement ($
in Millions)
Revenue
Cost Of Goods Sold
Gross Profit
Operating Expenses:
Selling, General & Admin.
Depreciation
Operating income
Interest
Other Expense (Income)
Income Before Taxes
Income Taxes
Net Income
Number of Common Stock
Shares Outstanding
Table 3: Financial Ratio Calculations
Calculate 3 Liquidity Ratios
Current Ratio (times)
Quick Ratio (times)
Average Payment Period (days)
Calculate 3 Asset-Management Ratios
Total Asset Turnover (times)
Average Collection Period (days)
Inventory Turnover (times)
Calculate 2 Financial Leverage Ratios
Total Debt to Total Assets
Equity Multiplier (times)
Calculate 5 Profitability Ratios
Operating Profit Margin
Net Profit Margin
Return on Total Assets
Return on Equity
Earnings per Share
Assets
Information
ILITIES
449.90 Accounts Payable
954.80 Salaries Payable
3,645.20 Other Current Liabilities
116.60 Total Current Liabilities
5,165.27
1,688.90
1,129.70 Total Liabilities
2,348.40
(575.60) SHAREHOLDER'S EQUITY
4,591.40 Common Stock
120.90 Retained Earnings
4,712.30 Total Shareholder's Equity
9,877.57 Total Liabilities & Equity
28,681.10
20,768.80
7,912.30
Operating
Expenses
Information
5,980.80
307.30
1,624.20
0
(13.10)
1,637.30
618.10
1,019.20
1,032,271
Liquidity Ratios
Answers
1.00
0.61
365.00
Asset-
Management
Ratios Answers
Other Liabilities
0.10
342 days
56973.00
Financial
Leverage Ratios
Answers
36.93%
1.59
Profitability
Ratios Answers
5.66%
3.55%
573.00%
16.30%
1019.19
Liabilities
Informa
1,611.20
225.20
1.118.80
2,955.20
693.40
3,648.60
Shareholder's
Equity Information
828.50
5,401.70
6,230.20
9,878.80
Expert Solution
This question has been solved!
Explore an expertly crafted, step-by-step solution for a thorough understanding of key concepts.
This is a popular solution
Trending nowThis is a popular solution!
Step by stepSolved in 3 steps with 2 images

Follow-up Questions
Read through expert solutions to related follow-up questions below.
Follow-up Question
Needing assistance with the Profability Ratio Answers

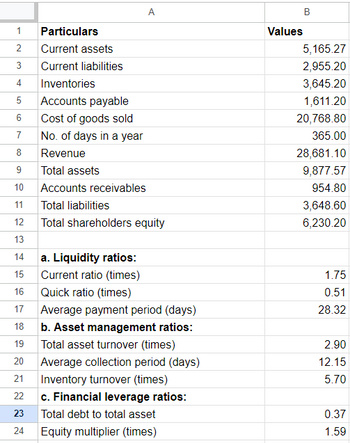
Transcribed Image Text:1 Particulars
2 Current assets
3 Current liabilities
Inventories
4
5 Accounts payable
6
Cost of goods sold
No. of days in a year
Revenue
Total assets
7
8
9
10 Accounts receivables
11
Total liabilities
12
Total shareholders equity
13
14
15
16
17
18
19 Total asset turnover (times)
85
A
20 Average collection period (days)
21 Inventory turnover (times)
222
23
a. Liquidity ratios:
Current ratio (times)
Quick ratio (times)
Average payment period (days)
b. Asset management ratios:
c. Financial leverage ratios:
Total debt to total asset
24 Equity multiplier (times)
B
Values
5,165.27
2,955.20
3,645.20
1,611.20
20,768.80
365.00
28,681.10
9,877.57
954.80
3,648.60
6,230.20
1.75
0.51
28.32
2.90
12.15
5.70
0.37
1.59

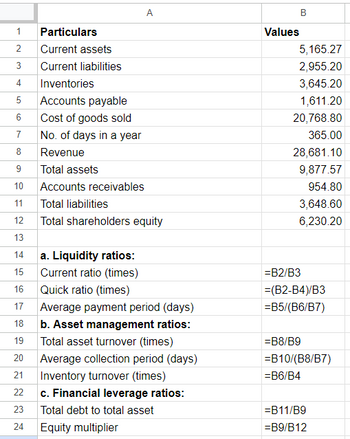
Transcribed Image Text:1 Particulars
2 Current assets
3
4 Inventories
5
6
7
لنا
Current liabilities
Accounts payable
Cost of goods sold
No. of days in a year
Revenue
9
Total assets
10 Accounts receivables
11
12
13
14
15
16
17
18
19
20
21
22
23
24
8
A
Total liabilities
Total shareholders equity
a. Liquidity ratios:
Current ratio (times)
Quick ratio (times)
Average payment period (days)
b. Asset management ratios:
Total asset turnover (times)
Average collection period (days)
Inventory turnover (times)
c. Financial leverage ratios:
Total debt to total asset
Equity multiplier
Values
B
5,165.27
2,955.20
3,645.20
1,611.20
20,768.80
365.00
28,681.10
9,877.57
954.80
3,648.60
6,230.20
=B2/B3
=(B2-B4)/B3
=B5/(B6/B7)
=B8/B9
=B10/(B8/B7)
=B6/B4
=B11/B9
=B9/B12
Solution
by Bartleby Expert
Follow-up Questions
Read through expert solutions to related follow-up questions below.
Follow-up Question
Needing assistance with the Profability Ratio Answers

Transcribed Image Text:1 Particulars
2 Current assets
3 Current liabilities
Inventories
4
5 Accounts payable
6
Cost of goods sold
No. of days in a year
Revenue
Total assets
7
8
9
10 Accounts receivables
11
Total liabilities
12
Total shareholders equity
13
14
15
16
17
18
19 Total asset turnover (times)
85
A
20 Average collection period (days)
21 Inventory turnover (times)
222
23
a. Liquidity ratios:
Current ratio (times)
Quick ratio (times)
Average payment period (days)
b. Asset management ratios:
c. Financial leverage ratios:
Total debt to total asset
24 Equity multiplier (times)
B
Values
5,165.27
2,955.20
3,645.20
1,611.20
20,768.80
365.00
28,681.10
9,877.57
954.80
3,648.60
6,230.20
1.75
0.51
28.32
2.90
12.15
5.70
0.37
1.59

Transcribed Image Text:1 Particulars
2 Current assets
3
4 Inventories
5
6
7
لنا
Current liabilities
Accounts payable
Cost of goods sold
No. of days in a year
Revenue
9
Total assets
10 Accounts receivables
11
12
13
14
15
16
17
18
19
20
21
22
23
24
8
A
Total liabilities
Total shareholders equity
a. Liquidity ratios:
Current ratio (times)
Quick ratio (times)
Average payment period (days)
b. Asset management ratios:
Total asset turnover (times)
Average collection period (days)
Inventory turnover (times)
c. Financial leverage ratios:
Total debt to total asset
Equity multiplier
Values
B
5,165.27
2,955.20
3,645.20
1,611.20
20,768.80
365.00
28,681.10
9,877.57
954.80
3,648.60
6,230.20
=B2/B3
=(B2-B4)/B3
=B5/(B6/B7)
=B8/B9
=B10/(B8/B7)
=B6/B4
=B11/B9
=B9/B12
Solution
by Bartleby Expert
Knowledge Booster
Similar questions
- Question Content Area Use the information provided for Harding Company to answer the question that follow. Harding Company Accounts payable $33,234 Accounts receivable 67,995 Accrued liabilities 6,510 Cash 22,738 Intangible assets 35,347 Inventory 83,390 Long-term investments 101,069 Long-term liabilities 79,156 Notes payable (short-term) 27,161 Property, plant, and equipment 689,074 Prepaid expenses 2,037 Temporary investments 30,842 Based on the data for Harding Company, what is the quick ratio (rounded to one decimal place)? a.3.1 b.0.8 c.1.8 d.15.4arrow_forwardJ-Mark Superstores provides the following selected financial data. Cash and cash equivalents Short-term investments Accounts receivable Inventory Property, plant and equipment Long-term investments Total asset 2024 $ 852,540 45,050 1,120,545 2023 $ 750,235 39,194 1,030,901 2,812,020 2,615,179 4,212,686 3,749,291 96,555 82,072 9,139,396 8,266,871 Total liabilities 4,204,122 3,968,098 Total stockholders' equity 4,935,274 4,298,773 Net sales 15,579,865 13,710,281 Operating income 5,452,953 4,661,496 Interest expense 157,655 148,804 Investment income 5,947 4,851 Calculate the return on investments ratio for 2024. Note: Round your answer to 1 decimal place. Answer is complete but not entirely correct. Return on investments ratio 4.2 × %arrow_forwardAccounts payable 919 Accounts receivable 631 Accumulated depreciation 1,813 Cash 729 Common stock 1,387 Cost of goods sold 7,578 Current portion of long-term debt 24 Depreciation expense 108 Dividends 13 Goodwill and other long-term assets 2,627 Income tax expense 24 Income taxes payable 12 Interest expense 54 Interest revenue 11 Inventories 930 Long-term liabilities 1,585 Prepaid expenses and other current assets 65 Property and equipment 2,389 Retained earnings 825 Sales 9,710 Selling, general, and administrative expenses 2,276 Unearned revenue 990 Wages payable 148 Prepare the balance sheet.arrow_forward
- Prepare a blance sheetarrow_forwardCurrent assets: Cash and marketable securities Accounts receivable Inventory Total Assets Fixed assets: Gross plant and equipment Less: Accumulated depreciation Net plant and equipment Other long-term assets Total Total assets Net sales Less: Cost of goods sold Gross profits Less: Other operating expenses 2024 VALIUM'S MEDICAL SUPPLY CORPORATION Balance Sheet as of December 31, 2024 and 2023 (in millions of dollars) $ 72 187 312 $ 571 Earnings per share (EPS) Dividends per share (DPS) Book value per share (BVPS) Market value (price) per share (MVPS) 2023 $ 71 181 291 $ 543 $ 1,073 146 $ 927 134 $ 1,061 $ 1,632 $ 1,446 $ 882 113 $ 769 134 $ 903 Liabilities and Equity Current liabilities: Accrued wages and taxes Accounts payable Notes payable Total Long-term debt Stockholders' equity: Preferred stock (6 thousand shares) Common stock and paid-in surplus (100 thousand shares) Retained earnings Total VALIUM'S MEDICAL SUPPLY CORPORATION Income Statement for Years Ending December 31, 2024 and…arrow_forwardperience p....pptm ^ Type here to search w X # 3 E Coronado Company's condensed financial statements provide the following information. C Cash Accounts receivable (net) Short-term investments Inventory Prepaid expenses Total current assets Property, plant, and equipment (net) Total assets Current liabilities ACC341-2022-Ho....xlsx $ 4 Bonds payable R F % 5 O CORONADO COMPANY BALANCE SHEET T At O+ 6 V B ▶ music 2.jpeg n H & 7 Dec. 31, 2020 $52,100 197,700 80,800 442,700 3,000 $776,300 849,900 $1,626,200 237,700 401,800 U 20 8 J Dec. 31, 2019 $60,200 O 80,800 39,600 N M 360,200 $547,700 849,900 $1,397,600 6,900 155,700 ( 401,800 9 W K F11 ) O 0 888 P Home End C Rair Insearrow_forward
- Assets Current assets: Cash and marketable securities Accounts receivable Inventory Total Fixed assets: Gross plant and equipment Less: Depreciation Net plant and equipment Other long-term assets Total Total assets Net sales (all credit) Less: Cost of goods sold Gross profits Less: Other operating expenses Earnings per share (EPS) Dividends per share (DPS) Book value per share (BVPS) Market value (price) per share (MVPS) 2821 $ 75 115 200 $390 ROA ROE $580 110 $470 50 $520 $910 Less: Depreciation Earnings before interest and taxes (EBIT) Less: Interest Earnings before taxes (EBT) Less: Taxes Net income Less: Preferred stock dividends Net income available to common stockholders Less: Common stock dividends Addition to retained earnings Per (common) share data: 96 96 Earnings before interest, taxes, depreciation, and amortization (EBITDA) 2020 $ 65 110 198 $365 DuPont Analysis times times $471 100 $371 LAK OF EGYPT MARINA, INC. Income Statement for Years Ending December 31, 2021 and 2020…arrow_forwardAssets Cash Receivables (net) Inventory PP & E (net) Patents&Licenses Goodwill Total assets Liabilities & Equity Accounts payable Short term debt Long term debt Preferred stock Common Equity Total Liabilities + Equity New Chip Corp Balance Sheet at 12/31/22 ($ in Millions) 31 45 64 215 28 19 402 53 19 179 23 128 402arrow_forwardmework i 0 ences Mc Graw Hill INCOME STATEMENT OF QUICK BURGER CORPORATION, 2022 (Figures in $ millions) Net sales Costs Depreciation Earnings before interest and taxes (EBIT) Interest expense Pretax income Federal taxes (@ 21%) Net income Assets Current assets Cash and marketable securities Receivables Inventories Other current assets Total current assets Fixed assets Property, plant, and equipment Intangible assets (goodwill) Other long-term assets Total assets a. Free cash flow b. Additional tax c. Free cash flow million million million $ 27,571 17,573 1,406 $ 8,592 521 2022 8,071 1,695 $ 6,376 BALANCE SHEET OF QUICK BURGER CORPORATION, 2022 (Figures in $ millions) 2021 $ 2,340 1,379 126 1,093 $ 4,938 $ 24,681 2,808 2,987 $ 35,414 $ 2,340 1,339 121 620 $ 4,420 Saved $ 22,839 2,657 3,103 Liabilities and Shareholders' Equity Current liabilities Debt due for repayment Long-term debt Other long-term liabilities Total liabilities Total shareholders' equity $ 33,019 Total liabilities and…arrow_forward
- Assets Current assets: Cash Marketable securities Accounts receivable (net) Inventory Total current assets Investments Plant and equipment Less: Accumulated depreciation Net plant and equipment Total assets Liabilities and Stockholders' Equity Current liabilities: Accounts payable Notes payable Accrued taxes Total current liabilities Long-term liabilities: Bonds payable Total liabilities Stockholders' equity Preferred stock, $ 50 par value Common stock, $ 1 par value Capital paid in excess of par Retained earnings Total stockholders' equity Total liabilities and stockholders' equity $ 611,000 272,000 $ 52,500 22,500 178,000 290,000 $ 543,000 66,200 339,000 $948,200 $ 95,100 78,700 12,000 $ 185,800 159,400 $ 345,200 $ 100,000 80,000 190,000 233,000 $ 603,000 $948,200arrow_forwardBalance Sheet as at As at 30/9/16 As at 30/9/15 $ $ Assets Current assets- Cash 8,200 9,400 Accounts Receivable 107,000 103,500 Inventory 82,700 71,300 Non-current assets less accumulated depreciation 242,600 245,700 Total assets 440,500 429,900 Liabilities and Owners' equity Current liabilities 117,000 120,000 Loan (repayable in 2019) 152,000 150,000 Total liabilities 269,000 270,000 Owners' equity 171,500 159,900 Total Liabilities and Owners' equity 440,500 429,900 Summarised Income Statement of Bishan Enterprise for the year ended 30 September 2016 $ Sales 990,000 Cost of goods sold 580,000 Gross profit 410,000 Operating expenses 350,000 Net profit 60,000 · Note - The owner withdrew $48,400 during 2016. Required: Calculate…arrow_forwardsarrow_forward
arrow_back_ios
arrow_forward_ios
Recommended textbooks for you
 Essentials Of InvestmentsFinanceISBN:9781260013924Author:Bodie, Zvi, Kane, Alex, MARCUS, Alan J.Publisher:Mcgraw-hill Education,

 Foundations Of FinanceFinanceISBN:9780134897264Author:KEOWN, Arthur J., Martin, John D., PETTY, J. WilliamPublisher:Pearson,
 Fundamentals of Financial Management (MindTap Cou...FinanceISBN:9781337395250Author:Eugene F. Brigham, Joel F. HoustonPublisher:Cengage Learning
 Corporate Finance (The Mcgraw-hill/Irwin Series i...FinanceISBN:9780077861759Author:Stephen A. Ross Franco Modigliani Professor of Financial Economics Professor, Randolph W Westerfield Robert R. Dockson Deans Chair in Bus. Admin., Jeffrey Jaffe, Bradford D Jordan ProfessorPublisher:McGraw-Hill Education

Essentials Of Investments
Finance
ISBN:9781260013924
Author:Bodie, Zvi, Kane, Alex, MARCUS, Alan J.
Publisher:Mcgraw-hill Education,


Foundations Of Finance
Finance
ISBN:9780134897264
Author:KEOWN, Arthur J., Martin, John D., PETTY, J. William
Publisher:Pearson,

Fundamentals of Financial Management (MindTap Cou...
Finance
ISBN:9781337395250
Author:Eugene F. Brigham, Joel F. Houston
Publisher:Cengage Learning

Corporate Finance (The Mcgraw-hill/Irwin Series i...
Finance
ISBN:9780077861759
Author:Stephen A. Ross Franco Modigliani Professor of Financial Economics Professor, Randolph W Westerfield Robert R. Dockson Deans Chair in Bus. Admin., Jeffrey Jaffe, Bradford D Jordan Professor
Publisher:McGraw-Hill Education