
Essentials Of Investments
11th Edition
ISBN: 9781260013924
Author: Bodie, Zvi, Kane, Alex, MARCUS, Alan J.
Publisher: Mcgraw-hill Education,
expand_more
expand_more
format_list_bulleted
Related questions
Concept explainers
Topic Video
Question

Transcribed Image Text:mework i
0
ences
Mc
Graw
Hill
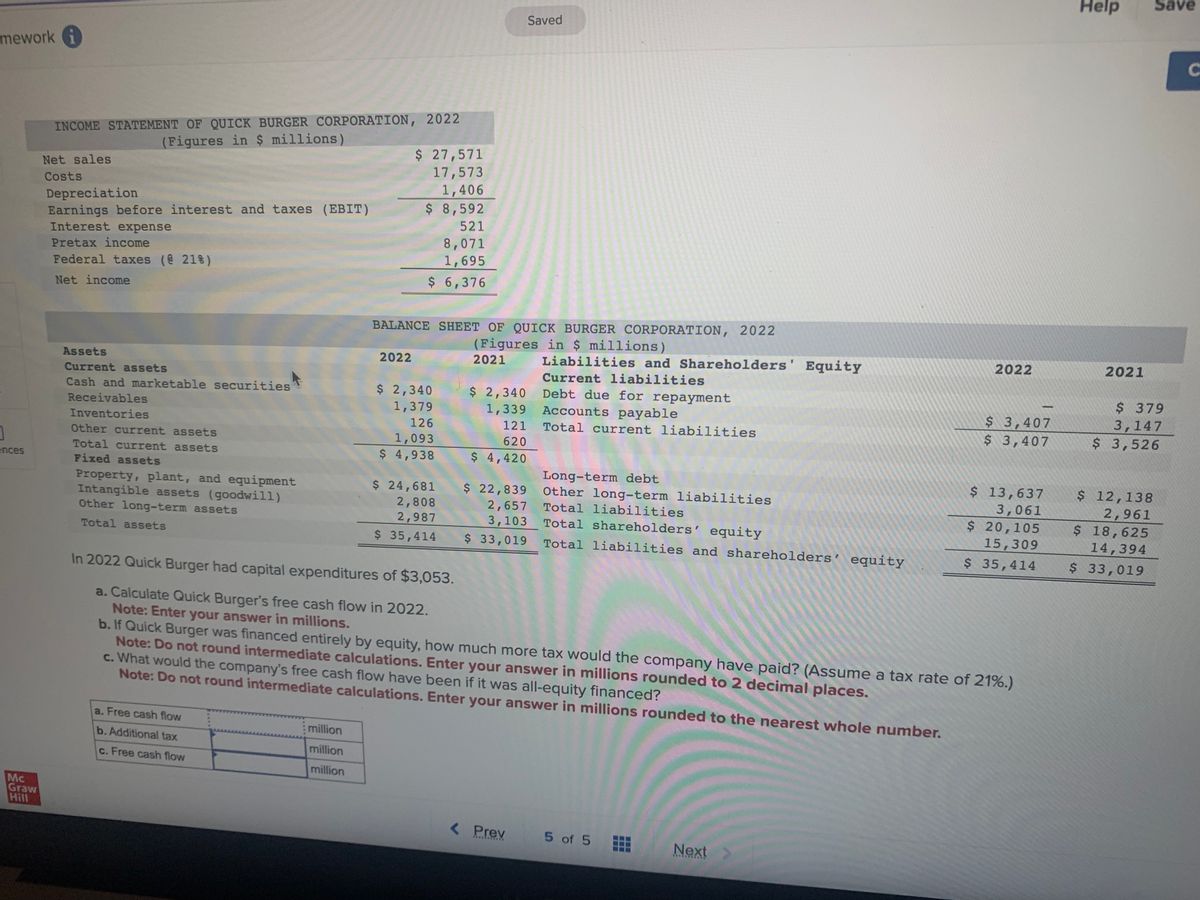
INCOME STATEMENT OF QUICK BURGER CORPORATION, 2022
(Figures in $ millions)
Net sales
Costs
Depreciation
Earnings before interest and taxes (EBIT)
Interest expense
Pretax income
Federal taxes (@ 21%)
Net income
Assets
Current assets
Cash and marketable securities
Receivables
Inventories
Other current assets
Total current assets
Fixed assets
Property, plant, and equipment
Intangible assets (goodwill)
Other long-term assets
Total assets
a. Free cash flow
b. Additional tax
c. Free cash flow
million
million
million
$ 27,571
17,573
1,406
$ 8,592
521
2022
8,071
1,695
$ 6,376
BALANCE SHEET OF QUICK BURGER CORPORATION, 2022
(Figures in $ millions)
2021
$ 2,340
1,379
126
1,093
$ 4,938
$ 24,681
2,808
2,987
$ 35,414
$ 2,340
1,339
121
620
$ 4,420
Saved
$ 22,839
2,657
3,103
Liabilities and Shareholders' Equity
Current liabilities
Debt due for repayment
Long-term debt
Other long-term liabilities
Total liabilities
Total shareholders' equity
$ 33,019 Total liabilities and shareholders' equity
< Prev
***********
Accounts payable
Total current liabilities
In 2022 Quick Burger had capital expenditures of $3,053.
a. Calculate Quick Burger's free cash flow in 2022.
Note: Enter your answer in millions.
b. If Quick Burger was financed entirely by equity, how much more tax would the company have paid? (Assume a tax rate of 21%.)
Note: Do not round intermediate calculations. Enter your answer in millions rounded to 2 decimal places.
c. What would the company's free cash flow have been if it was all-equity financed?
Note: Do not round intermediate calculations. Enter your answer in millions rounded to the nearest whole number.
5 of 5
2022
Next
SHARROAK
$ 3,407
$ 3,407
-
$ 13,637
3,061
$ 20,105
15,309
$ 35,414
Help
2021
Save
$ 379
3,147
$ 3,526
$ 12,138
2,961
$ 18,625
14,394
$ 33,019
C
Expert Solution
This question has been solved!
Explore an expertly crafted, step-by-step solution for a thorough understanding of key concepts.

This is a popular solution

Trending nowThis is a popular solution!

Step by stepSolved in 3 steps

Knowledge Booster


Learn more about
Need a deep-dive on the concept behind this application? Look no further. Learn more about this topic, finance and related others by exploring similar questions and additional content below.Similar questions
- Balance Sheet You are evaluating the balance sheet for Cypress Corporation. From the balance sheet you find the following balances: Cash and marketable securities = $670,000, Accounts receivable = $870,000, Inventory = $570,000, Accrued wages and taxes = $111,000, Accounts payable = $207,000, and Notes payable = $1,070,000. What is Cypress's net working capital? Multiple Choice $1,388,000 O $2,110,000 $722,000 O $3,498,000arrow_forwardSelected information follows for Sheridan Corporation for 2023: Accounts payable $60,300 Cash 240,000 Cost of goods sold 580, 000 Income tax expense 31, 400 Interest expense 3,500 Retained earnings 377,000 Sales revenue 757, 500 Selling expenses 61,800 Calculate Sheridan's net income for 2023. (Enter loss using either a negative sign preceding the number e.g. -45 or parentheses e.g. (45).) Net income Senter the net income in dollars 79800 Incorrect answer eTextbook and Mediaarrow_forwardComparative financial statement data for Blossom Company and Oriole Company, two competitors, appear below. All balance sheet data are as of December 31, 2022. Net sales. Cost of goods sold Operating expenses Interest expense Income tax expense Current assets Plant assets (net) Current liabilities Long-term liabilities Net cash common by operating activities Capital expenditures Dividends paid on common stock Weighted-average common shares outstanding Blossom Company Oriole Company 2022 Net Income $2,592,000 1,692,000 407,520 9,980 $ 122,500 496,600 766,000 95,500 157,020 198,720 129,600 51,840 80,000 2022 $892,800 489,600 141,120 4,240 51,840 213,840 201,160 (a) Compute the net income and earnings per share for each company for 2022. (Round Earnings per share to 2 decimal places, eg $2.78) Earnings per share 48,600 58,470 51,840 28,800 21,600 50,000arrow_forward
- The following are financial statements of Carla Vista Co.. Carla Vista Co.Income StatementFor the Year Ended December 31, 2022 Net sales $2,247,500 Cost of goods sold 1,018,500 Selling and administrative expenses 901,000 Interest expense 82,000 Income tax expense 75,000 Net income $ 171,000 Carla Vista Co.Balance SheetDecember 31, 2022 Assets Current assets Cash $ 56,300 Debt investments 81,000 Accounts receivable (net) 169,500 Inventory 118,900 Total current assets 425,700 Plant assets (net) 574,000 Total assets $ 999,700 Liabilities and Stockholders’ Equity Current liabilities Accounts payable $ 161,000 Income taxes payable 37,000 Total current liabilities 198,000 Bonds payable 201,880 Total liabilities 399,880 Stockholders’ equity Common stock 355,000 Retained earnings 244,820…arrow_forwardWhich of the following statements is TRUE about Verizon's financial statements? verizon Consolidated Balance Sheets (In millions of dollars) As of As of Dec 31, 2020 $ 22,171 Dec 31, 2019 $ 2,594 ASSETS Cash and cash equivalents Accounts receivable 23,917 25,429 Inventories 1,796 1,422 Prepaid expenses and other current assets 6,710 8,028 Total current assets 54,594 37,473 Property and equipment, net Intangible assets Other long-term assets 94,833 91,915 152,814 151,640 10,699 $ 291,727 14,240 Total assets $ 316,481 LIABILITIES & EQUITY Debt maturing within one year $ 5,889 $ 10,777 Accounts payable and accrued liabilities 20,658 21,806 Other current liabilities 13,113 12,285 Total current liabilities 39,660 44,868 Long-term debt 123,173 100,712 Other long-term liabilities 84,376 83,312 Total liabilities 247,209 228,892 Common stock and additional paid in capital 13,833 13,858 Retained earnings 60,464 53,147 Accumulated other comprehensive income (5,025) (4,170) Total shareholders'…arrow_forwardCategory. Prior Year Current Year Accounts payable ??? ??? Accounts receivable 320,715 397,400 Accruals 40,500 33,750 Additional paid in capital 500,000 541,650 Cash 17,500 47,500 Common Stock 94,000 105,000 COGS 328,500 429,735.00 Current portion long-term debt 33,750 35,000 Depreciation expense 54,000 55,152.00 Interest expense 40,500 42,662.00 Inventories 279,000 288,000 Long-term debt 339,349.00 400,985.00 Net fixed assets 946,535 999,000 Notes payable 148,500 162,000 Operating expenses (excl. depr.) 126,000 161,641.00 Retained earnings 306,000 342,000 Sales 639,000 848,846.00 Тахes 24,750 47,931.00arrow_forward
- Compute and Interpret Ratios Selected balance sheet and income statement information from Illinois Tool Works follows. $ millions 2019 2018 2017 Net operating profit after tax (NOPAT) $2,480 $2,575 Net income 2,395 2,435 Total assets 13,561 13,383 $15,102 Equity 2,723 2,929 2,929 Net operating profit after tax (NOA) 7,982 8,516 9,080 Treasury stock 18,033 16,668 14,784 Compute profitability measures: RNOA, ROA and ROE for 2019 and 2018 using the numbers as reported by the company. Note: Round answers to one decimal place (ex: 0.2345 = 23.5%). b. Adjust equity and total assets for the amount of treasury stock. Using these restated numbers, recompute RNOA, ROA and ROE for both years.Note: Round answers to one decimal place (ex: 0.2345 = 23.5%).arrow_forwardWhat is the debit to asset ratio?arrow_forwardFinancial statements for Askew Industries for 2024 are shown below (in thousands): 2024 Income statement Net sales Cost of goods sold Gross profit Operating expenses Interest expense Income tax expense Net income Assets Cash $ 9,400 (6,400) 3,000 (2,200) (240) (224) $ 336 Bonds payable Common stock Retained earnings Comparative Balance Sheets. Accounts receivable Inventory Property, plant, and equipment (net) Liabilities and Shareholders' Equity Current liabilities December 31 2024 $ 640 640 840 2,400 $ 4,520 $ 1,340 1,600 640 940 $ 4,520 2023 $ 540 440 640 2,500 $4,120 $ 1,090 1,600 640 790 $ 4,220 Required: Calculate the following ratios for 2024 Note: Consider 365 days a year. Do not round intermediate calculations and round your final answers to 2 decimal places.arrow_forward
- Please help mearrow_forwardSome recent financial statements for Smolira Golf Corporation follow. Assets Current assets Cash Accounts receivable Inventory Total Total assets Fixed assets Net plant and equipment $336,695 Sales Cost of goods sold Depreciation Taxable income Taxes (22%) Net income SMOLIRA GOLF CORPORATION 2021 Income Statement Earnings before interest and taxes Interest paid Dividends Retained earnings a. Current ratio b. Quick ratio c. Cash ratio Short-term solvency ratios: Asset utilization ratios: d. Total asset turnover e. Inventory tumover 1. Receivables turnover 2020 $23,066 $25,300 13,648 16,400 27,152 28,300 $63,866 $70,000 g. Total debt ratio h. Debt-equity ratio I. Equity multiplier Long-term solvency ratios: Times Interest emned K Cash coverage ratio Profitability ratios: SMOLIRA GOLF CORPORATION 2020 and 2021 Balance Sheets 2021 $ 400,561 $ 434,000 1. Profit margin m. Return on assels n. Return on equity $ 364,000 $ 22,000 19,891 Find the following financial ratios for Smolira Golf…arrow_forwardFinancial information for Powell Panther Corporation is shown below: Powell Panther Corporation: Income Statements for Year Ending December 31 (Millions of Dollars) 2018 2017 Sales $ 3,900.0 $ 3,000.0 Operating costs excluding depreciation and amortization 2,925.0 2,550.0 EBITDA $ 975.0 $ 450.0 Depreciation and amortization 90.0 69.0 Earnings before interest and taxes (EBIT) $ 885.0 $ 381.0 Interest 86.0 66.0 Earnings before taxes (EBT) $ 799.0 $ 315.0 Taxes (40%) 319.6 126.0 Net income $ 479.4 $ 189.0 Common dividends $ 431.0 $ 151.0 Powell Panther Corporation: Balance Sheets as of December 31 (Millions of Dollars) 2018 2017 Assets Cash and equivalents $ 38.0 $ 30.0 Accounts receivable 432.0 360.0 Inventories 819.0 630.0 Total current assets $ 1,289.0 $ 1,020.0 Net plant and equipment 897.0 690.0 Total assets $ 2,186.0 $ 1,710.0 Liabilities and Equity…arrow_forward
arrow_back_ios
SEE MORE QUESTIONS
arrow_forward_ios
Recommended textbooks for you
- Essentials Of InvestmentsFinanceISBN:9781260013924Author:Bodie, Zvi, Kane, Alex, MARCUS, Alan J.Publisher:Mcgraw-hill Education,


 Foundations Of FinanceFinanceISBN:9780134897264Author:KEOWN, Arthur J., Martin, John D., PETTY, J. WilliamPublisher:Pearson,
 Fundamentals of Financial Management (MindTap Cou...FinanceISBN:9781337395250Author:Eugene F. Brigham, Joel F. HoustonPublisher:Cengage Learning
 Corporate Finance (The Mcgraw-hill/Irwin Series i...FinanceISBN:9780077861759Author:Stephen A. Ross Franco Modigliani Professor of Financial Economics Professor, Randolph W Westerfield Robert R. Dockson Deans Chair in Bus. Admin., Jeffrey Jaffe, Bradford D Jordan ProfessorPublisher:McGraw-Hill Education
Essentials Of Investments
Finance
ISBN:9781260013924
Author:Bodie, Zvi, Kane, Alex, MARCUS, Alan J.
Publisher:Mcgraw-hill Education,
Foundations Of Finance
Finance
ISBN:9780134897264
Author:KEOWN, Arthur J., Martin, John D., PETTY, J. William
Publisher:Pearson,
Fundamentals of Financial Management (MindTap Cou...
Finance
ISBN:9781337395250
Author:Eugene F. Brigham, Joel F. Houston
Publisher:Cengage Learning
Corporate Finance (The Mcgraw-hill/Irwin Series i...
Finance
ISBN:9780077861759
Author:Stephen A. Ross Franco Modigliani Professor of Financial Economics Professor, Randolph W Westerfield Robert R. Dockson Deans Chair in Bus. Admin., Jeffrey Jaffe, Bradford D Jordan Professor
Publisher:McGraw-Hill Education