FORD MOTOR CO.DL-NOTES 1999(29)
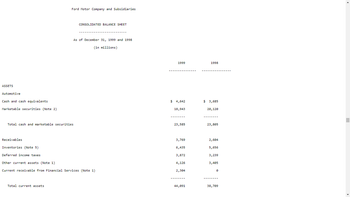
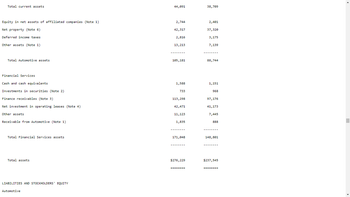
FORD CO. Balance Sheets: What did the
FORD CO. Trends in YTM and Price: At what price and yield-to-maturity (YTM) was the initial FORD MOTOR CO.DL-NOTES 1999(29) offering sold? Tabulate the price and YTM of the issue at the end of each calendar quarter for the last six quarters. Then, using Excel, plot the tabulated values to visualize the trends in YTM and prices and include the graph/chart in an Appendix. Briefly discuss your graph/chart and what the results indicate.
FORD CO.
Conclusion: Based on your research in Sections 1-4, discuss at least three overall conclusions about this offering. please recap your analysis so another invester can make an educated investment decision. This should draw together all that you have researched and analyzed and provide a well-supported investment recommendation.
BALANCE SHEET: http://getfilings.com/o0000037996-00-000019.html


to generate a solution
a solution
- Category Accounts payable Accounts receivable Accruals Additional paid in capital Cash Common Stock COGS Current portion long-term debt Depreciation expense Interest expense Inventories Long-term debt Net fixed assets Notes payable Operating expenses (excl. depr.) Retained earnings Sales Taxes Prior Year Current Year 3,106.00 5,972.00 6,919.00 8,940.00 5,691.00 6,099.00 20,212.00 13,343.00 ??? ??? 2,850 18,751.00 500 2,850 22,826.00 500 965.00 1,016.00 1,259.00 1,123.00 3,086.00 6,750.00 16,982.00 22,296.00 75,731.00 73,844.00 4,053.00 6,596.00 19,950 20,000 35,937.00 34,762.00 46,360 45,530.00 350 920 What is the firm's cash flow from operations? Submit Answer format: Number: Round to: 0 decimal places.arrow_forwardO Accounts payable Accounts receivable Accruals Category Additional paid in capital Cash Common Stock COGS Current portion long-term debt Depreciation expense Interest expense Inventories Long-term debt Not fixed assets Notes payable Operating expenses (excl. depr.) Retained earnings Sales Taxes Prior Year Current Year 3,153.00 5,992.00 6,936.00 9,031.00 5,792.00 6,116.00 20,429.00 13,896.00 ??? Category 222 2,850 22,561.00 500 952.00 4,008.00 46,360 350 What is the firm's cash flow from financing? 1,259.00 1,120.00 3,060.00 6,658.00 16,820.00 22,100.00 75,431.00 74,071.00 6,567.00 19,950 20,000 35,524.00 34,531.00 45,432.00 2,850 Submit 18,594.00 500 1,019.00 920 Answer format: Number: Round to: 0 decimal placesarrow_forwardCategory Accounts payable Accounts receivable Accruals Additional paid in capital Cash Common Stock COGS Current portion long-term debt Depreciation expense Interest expense Inventories Long-term debt Net fixed assets Notes payable Operating expenses (excl. depr.) Retained earnings Sales Taxes Prior Year Current Year ??? ??? 320,715 397,400 40,500 33,750 500,000 541,650 17,500 47,500 94,000 105,000 328,500 431,876.00 33,750 35,000 54,000 54,402.00 40,500 42,823.00 279,000 288,000 339,660.00 398,369.00 946,535 999,000 148,500 162,000 126,000 162,881.00 306,000 342,000 639,000 847,928.00 24,750 47,224.00 What is the current year's return on assets (ROA)? Submit Answer format: Percentage Round to: 2 decimal places (Example: 9.24%, % sign required. Will accept decimal format rounded to 4 decimal places (ex: 0.0924))arrow_forward
- Assets Cash S.T. Investments Accts Receivable Inventories Total Current Assets Net PP&E Total Assets Liabilities. Accts Payable Notes Payable Accruals Balance Sheet Current Liabilities L.T. Bonds Preferred Stock Common Stock Retained Earnings Total Equity Total Liab. & Equity Less: Interest 2021 120 30 400 Pre-tax Earnings 1,200 1,750 3,000 4,750 100 100 300 500 520 200 530 3,000 3,530 4,750 Net Sales COGS except Dep Depreciation & Amortization Other Operating Expenses EBIT Income Statements 2021 5,500 3,800 180 600 920 60 860 215 Taxes (25%) Preferred Dividends 15 Net Income for CS Holders 630 2020 $102 40 384 774 1. What is the company's MVA? 2. What is the company's EVA in? 3. What is the current ratio of the Company? 1,300 1,780 3,080 180 28 370 578 350 100 500 1,552 2,052 3,080 Number of Common Stock Outstanding = 1,200 Price of Common Stock = 4.00 WACC Cost of Capital = 12.0% Return on Investment (ROI)= 15.97% 2020 4,800 3,710 180 470 440 40 400 100 7 293arrow_forwardCategory Prior Year Current Year Accounts payable ??? ??? Accounts receivable 320,715 397,400 Accruals 40,500 33,750 Additional paid in capital 500,000 541,650 Cash 17,500 47,500 Common Stock 94,000 105,000 COGS 328,500 428,571.00 Current portion long-term debt 33,750 35,000 Depreciation expense 54,000 54,035.00 Interest expense 40,500 42,155.00 Inventories 279,000 288,000 Long-term debt 339,577.00 401,377.00 Net fixed assets 946,535 999,000 Notes payable 148,500 162,000 Operating expenses (excl. depr.) 126,000 162,171.00 Retained earnings 306,000 342,000 Sales 639,000 849,094.00 Taxes 24,750 47,192.00 What is the current year's entry for long-term debt on a common-sized balance sheet? (ROUND TO 4 DECIMAL PLACES.)arrow_forwardThe following table shows an abbreviated income statement and balance sheet for McDonald's Corporation for 2012. INCOME STATEMENT OF MCDONALD'S CORP., 2012 (Figures in $ millions) Net sales Costs Depreciation Earnings before interest and taxes (EBIT) Interest expense Pretax income Taxes Net income 27,570 17,572 1,405 8,593 520 8,073 2,620 5,453arrow_forward
- Category Prior Year Current Year Accounts payable ??? Accounts receivable 320,715 397,400 Accruals 40,500 33,750 Additional paid in capital 500,000 541,650 Cash 17,500 47,500 Common Stock 94,000 105,000 COGS 328,500 431,516.41 Current portion long-term debt 33,750 35,000 Depreciation expense 54,000 55,946.66 Interest expense 40,500 41,874.31 Inventories 279,000 288,000 Long-term debt 336,467.85 401,942.46 Net fixed assets 946,535 999,000 Notes payable 148,500 162,000 Operating expenses (excl. depr.) 126,000 161,499.58 Retained earnings 306,000 342,000 Sales 639,000 854,554.01 Taxes 24,750 48,384.56 ??? What is the current year's return on equity (ROE)? Submit Answer format: Percentage Round to: 2 decimal places (Example: 9.24%, % sign re rounded to 4 decimal places (ex: 0.0924))arrow_forwardAssets Cash Receivables (net) Inventory PP & E (net) Patents&Licenses Goodwill Total assets Liabilities & Equity Accounts payable Short term debt Long term debt Preferred stock Common Equity Total Liabilities + Equity New Chip Corp Balance Sheet at 12/31/22 ($ in Millions) 31 45 64 215 28 19 402 53 19 179 23 128 402arrow_forwardCategory. Prior Year Current Year Accounts payable ??? ??? Accounts receivable 320,715 397,400 Accruals 40,500 33,750 Additional paid in capital 500,000 541,650 Cash 17,500 47,500 Common Stock 94,000 105,000 COGS 328,500 429,735.00 Current portion long-term debt 33,750 35,000 Depreciation expense 54,000 55,152.00 Interest expense 40,500 42,662.00 Inventories 279,000 288,000 Long-term debt 339,349.00 400,985.00 Net fixed assets 946,535 999,000 Notes payable 148,500 162,000 Operating expenses (excl. depr.) 126,000 161,641.00 Retained earnings 306,000 342,000 Sales 639,000 848,846.00 Тахes 24,750 47,931.00arrow_forward
- Category Prior Year Current Year Accounts payable ??? ??? Accounts receivable 320,715 397,400 Accruals 40,500 33,750 Additional paid in capital 500,000 541,650 Cash 17,500 47,500 Common Stock 94,000 105,000 COGS 328,500 431,139.00 Current portion long-term debt 33,750 35,000 Depreciation expense 54,000 54,349.00 Interest expense 40,500 41,741.00 Inventories 279,000 288,000 Long-term debt 337,728.00 398,725.00 Net fixed assets 946,535 999,000 Notes payable 148,500 162,000 Operating expenses (excl. depr.) 126,000 162,280.00 Retained earnings 306,000 342,000 Sales 639,000 847,106.00 Taxes 24,750 48,618.00 What is the current year's return on assets (ROA)? (Round to 4 decimal places.)arrow_forwardA10arrow_forwardCash Accounts receivable (net) Inventories Total current assets Noncurrent assets Current liabilities Long-term liabilities Shareholders' equity Net income Interest expense Income tax expense Sanchez Corporation Selected Financial Information The debt to equity ratio for 2016 is: OA) 0.80 OB) 0.44 Oc) 0.67 OD) 0.13 12/31/16 $ 20,000 100,000 190,000 310,000 230,000 200,000 40,000 300,000 $40,000 10,000 20,000arrow_forward
 Financial Accounting: The Impact on Decision Make...AccountingISBN:9781305654174Author:Gary A. Porter, Curtis L. NortonPublisher:Cengage Learning
