College Accounting, Chapters 1-27
23rd Edition
ISBN: 9781337794756
Author: HEINTZ, James A.
Publisher: Cengage Learning,
expand_more
expand_more
format_list_bulleted
Question

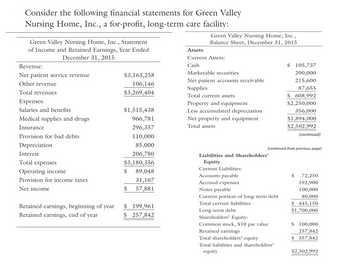
Transcribed Image Text:Consider the following financial statements for Green Valley
Nursing Home, Inc., a for-profit, long-term care facility:
Green Valley Nursing Home, Inc., Statement
of Income and Retained Earnings, Year Ended
December 31, 2015
Assets
Green Valley Nursing Home, Inc.,
Balance Sheet, December 31, 2015
Revenue:
Net patient service revenue
$3,163,258
Other revenue
Total revenues
106,146
$3,269,404
Expenses:
Salaries and benefits
$1,515,438
Medical supplies and drugs
966,781
Insurance
296,357
Current Assets:
Cash
Marketable securities
Net patient accounts receivable
Supplies
Total current assets
Property and equipment
Less accumulated depreciation
Net property and equipment
Total assets
$ 105,737
200,000
215,600
87,655
$ 608,992
$2,250,000
356,000
$1,894,000
$2,502,992
(continued)
Provision for bad debts
110,000
Depreciation
85,000
(continued from previous page)
Interest
206,780
Liabilities and Shareholders'
Total expenses
$3,180,356
Equity
Operating income
Current Liabilities:
$
89,048
Accounts payable
Provision for income taxes
31,167
Accrued expenses
Net income
$
57,881
Notes payable
Current portion of long-term debt
Total current liabilities
$
72,250
192,900
100,000
80,000
Retained earnings, beginning of year
$ 199,961
Retained earnings, end of year
$ 257,842
Long-term debt
Shareholders' Equity:
Common stock, $10 par value
Retained earnings
Total shareholders' equity
Total liabilities and shareholders'
equity
$ 445,150
$1,700,000
$ 100,000
257,842
$ 357,842
$2,502,992

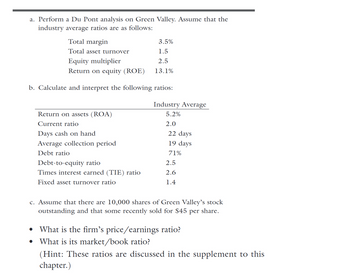
Transcribed Image Text:a. Perform a Du Pont analysis on Green Valley. Assume that the
industry average ratios are as follows:
Total margin
3.5%
Total asset turnover
1.5
Equity multiplier
2.5
Return on equity (ROE)
13.1%
b. Calculate and interpret the following ratios:
Industry Average
Return on assets (ROA)
Current ratio
5.2%
2.0
Days cash on hand
22 days
Average collection period
19 days
Debt ratio
71%
Debt-to-equity ratio
2.5
Times interest earned (TIE) ratio
2.6
Fixed asset turnover ratio
1.4
c. Assume that there are 10,000 shares of Green Valley's stock
outstanding and that some recently sold for $45 per share.
• What is the firm's price/earnings ratio?
What is its market/book ratio?
(Hint: These ratios are discussed in the supplement to this
chapter.)
Expert Solution
This question has been solved!
Explore an expertly crafted, step-by-step solution for a thorough understanding of key concepts.
This is a popular solution
Trending nowThis is a popular solution!
Step by stepSolved in 2 steps

Knowledge Booster
Similar questions
- Using the statements provided Calculate the following liquidity ratios: Current ratio Quick ratio Calculate the following asset management ratios: Average collection period Inventory turnover Fixed asset turnover Total asset turnover Calculate the following financial leverage ratios Debt to equity ratio Long-term debt to equity Calculate the following profitability ratios: Gross profit margin Net profit margin Return on assets Return on stockholders’ equity For example: you should present it like the text, or as:Gross margin = 1,933 divided by 8,689 = 22.2% A competitor of ACME has for the same time period reported the following three ratios: Current ratio 1.52Long-term debt to equity .25 or 25%Net profit margin .08 or 8% Given these three ratios only which company is performing better on each ratio? Also overall who would you say has the best financial performance and position. Support your answer.arrow_forwardNeed Answer with correct answer pleasearrow_forwardConsider that you have $4,332,989 to invest across three assets using the price weighted methodology. Your analysis of these assets has provided the information in the two tables below. (Note: numbers in red are negative) Asset Price at beginning of the year (in $) Expected price at the end of the year (in $) Standard deviation (%) Correlation A B C A 1.00 0.84 0.78 c. In dollars and cents, what is the expected value of this portfolio after 12 months? d. What is the standard deviation of this portfolio, in percentage terms? A B 155.55 137.22 182.22 164.77 42.11 Required a. What is the expected compound annual growth rate of return for this portfolio, in percentage terms? b. What is the expected continuously compounded return on this portfolio in percentage terms? B 0.84 1.00 0.44 41.50 с 0.78 0.44 1.00 C 88.14 104.12 42.33arrow_forward
- Need help pleasearrow_forwardFor each of the investments below, calculate the rate of return earned over the period. Investment Cash Flow During Period - $300 18,000 с 5,000 D 60 E 1,500 (Click on the icon here in order to copy the contents of the data table above into a spreadsheet.) A B The rate of return on Investment A is %. (Round to two decimal places.) Beginning-of-Period End-of-Period Value Value $2,100 160,000 40,000 300 12,000 $700 113,000 45,000 100 13,200arrow_forwardRequired: (a) You are required to calculate the following ratios:(i) Gross profit margin(ii) Operating profit margin(iii) Expenses to sales(iv) Return on Capital Employed(v) Asset turnover(vi) Non-current asset turnover(vii) Current Ratio(viii) Quick Ratio(ix) Inventory days(x) Receivables days(xi) Payable days(xii) Interest cover (b) In light of your calculations comment on the performance of the company over thelast two years.arrow_forward
- Return calculations For the investment shown in the following table, calculate the rate of return earned over the unspecified time period. (Click on the icon here in order to copy the contents of the data table below into a spreadsheet.) End-of- Cash flow during period $910 period value $16,400 The rate of return on the investment is %. (Round to two decimal places. If there is a loss, enter as a negative percentage.) Beginning-of- period value $21,900 -Carrow_forwardThe following information relates to four assets: Probability Return on E Return on F Return on G Return on H 0.1 10% 6% 14% 2% 0.2 10% 8% 12% 6% 0.4 10% 10% 10% 9% 0.2 10% 12% 8% 15% 0.1 10% 14% 6% 20% (a) What is the expected return for each of the assets? (4) (b) Calculate the variance of each asset. (8) (c) Determine the covariance of asset F and G. (4) (d) What is the correlation coefficient between assets F and G? (4)arrow_forwardCalculate IRR using excel.arrow_forward
- d. Calculate the Efficiency ratio which includes the sales to total assets ratio, operating return on assets, return on assets, ROA Model, return on equity, and ROE Modelarrow_forwardFor each of the investments below, calculate the rate of return earned over the period. Investment ABCDE Cash Flow During Beginning-of-Period End-of-Period Value Period Value - $400 13,000 4,000 60 1,700 $1,700 140,000 60,000 800 14,500 $800 117,000 46,000 400 12,600arrow_forwardCalculate the HPR of the following investment, entered as a percentage (Example: if your answer is 14.5%, enter 14.5 and not 0.145) Period Cashflow 0 -14100 1 3300 2 3300 3 3100 4 2800arrow_forward
arrow_back_ios
SEE MORE QUESTIONS
arrow_forward_ios
Recommended textbooks for you
 College Accounting, Chapters 1-27AccountingISBN:9781337794756Author:HEINTZ, James A.Publisher:Cengage Learning,
 Survey of Accounting (Accounting I)AccountingISBN:9781305961883Author:Carl WarrenPublisher:Cengage Learning
 EBK CONTEMPORARY FINANCIAL MANAGEMENTFinanceISBN:9781337514835Author:MOYERPublisher:CENGAGE LEARNING - CONSIGNMENT

College Accounting, Chapters 1-27
Accounting
ISBN:9781337794756
Author:HEINTZ, James A.
Publisher:Cengage Learning,

Survey of Accounting (Accounting I)
Accounting
ISBN:9781305961883
Author:Carl Warren
Publisher:Cengage Learning

EBK CONTEMPORARY FINANCIAL MANAGEMENT
Finance
ISBN:9781337514835
Author:MOYER
Publisher:CENGAGE LEARNING - CONSIGNMENT