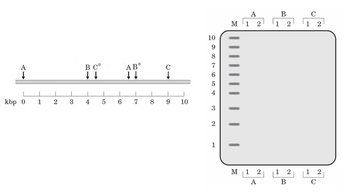
DNA is extracted from the blood cells of two different humans, individuals 1 and 2. In separate experiments, the DNA from each individual is cleaved by restriction endonucleases A, B, and C, and the fragments are separated by electrophoresis. A hypothetical map of a 10,000 bp (base pair) segment of a human chromosome is shown (1 kbp= 1,000 bp). Individual 2 has point mutations that eliminate restriction recognition sites B* and C*. After the 10kbp segment is digested with each restriction endonuclease A, B, and C one by one, samples are loaded onto an agarose gel for electrophoresis for analysis. I would like you to draw the result of gel electrophoresis. To answer the question, first, draw the whole gel image (on the right) on your answer sheet, then indicate where you expect to see the bands on the gel. (Hint1: Same-size bands will appear at the same position. Hint 2: On the gel bands from individuals 1 and 2 might be at different positions.) The left lane (with an M label on the top) of the gel are marking the size of each band in the diagram.

Trending nowThis is a popular solution!
Step by stepSolved in 5 steps

- The region of the normal hemoglobin gene used for genetic testing for sickle cell anemia contains a restriction site such that homozygous normal individuals show two DNA fragments. If a single nucleotide change in hemoglobin destroys that restriction site, then how many DNA fragments will be visible on a gel from individuals that are homozygous mutant? What about heterozygotes?arrow_forwardClone number in this case is number 196 which is shown in the images. State whether a BamHI site has been re-created at the forward- and the reverse-end junctions of the human DNA with the plasmid vector band sizes are shown in one of the images. (0.5, 1, 2, 3, 4, 5, 6, 8, 10kb)arrow_forwardAfter Drosophila DNA has been treated with a restrictionenzyme, the fragments are inserted into plasmids and selected as clones in E. coli. With the use of this “shotgun”technique, every DNA sequence of Drosophila in a librarycan be recovered.a. How would you identify a clone that contains DNAencoding the protein actin, whose amino acid sequenceis known?b. How would you identify a clone encoding a specifictRNAarrow_forward
- The Polymerase Chain Reaction is a molecular biology tool for exponentially amplifying DNA in a test tube in a cell free system. With this technique, DNA strands are separated by heating the mixture so that a DNA helicase is not required. A heat stable polymerase (Pol Z) is then used to copy DNA over and over in a tube. Recently an improved version of Pol Z was created by fusing Protein X, a DNA binding protein, to Pol Z (see left figure below). The right panel shows that fusion of Pol Z to Protein X significantly increases its efficiency. Briefly provide a plausible mechanism for how Protein X is improving Pol Z. Which prokarotic/eukaryotic protein activity is Protein X mimicking that increases the activity of the polymerase?arrow_forwardHgaI recognizes a specific 5 bp sequence. How frequently would you expect a specific 5 bp sequence to be found in any genome, considering that there are 4 possibilities for each of the 5 nucleotides in the restriction site sequence?arrow_forwarda.) wanting to clone gene Z into pVector, the gene is amplified by PCR and restriction sites are added to the flanking ends. without realizing that the antibotic resistant gen )tetR) had a Sal1 site, you decide to add EcoR1 and Sal1 recofnition sequencen into the 12-nucleotide primers. Write the sequence of the 2 primers, noting the 5' and 3' ends?arrow_forward
- How many fragments would you expect to be formed from digestion of a 2500 base pair long linear piece of DNA using a restriction enzyme with a 5 base pair recognition sequence?”arrow_forwardGenomic DNA from a family where sickle-cell disease is known to be hereditary, is digested with the restriction enzyme MstII and run in a Southern Blot. The blot is hybridised with two different 0.6 kb probes, both probes (indicated in red in the diagram below) are specific for the β-globin gene (indicated as grey arrow on the diagram below). The normal wild-type βA allele contains an MstII restriction site indicated with the asterisk (*) in the diagram below; in the mutated sickle-cell βS allele this restriction site has been lost. What size bands would you expect to see on the Southern blots using probe 1 and probe 2 for an individual with sickle cell disease (have 2 βS alleles)? Probe 1 Probe 2 (a) 0.6kb 0.6kb and 1.2kb (b) 0.6kb and 1.8kb 0.6kb, 1.2kb and 1.8kb (c) 1.2kb 0.6kb (d) 1.8kb 1.8kb a. (a) b. (b) c. (c) d. (d)arrow_forwardTripartite motif-containing protein 5a or TRIM5a is a cellular antiviral restriction factor. Briefly describe the mechanism that prevents early replication eventsarrow_forward