Financial Accounting (12th Edition) (What's New in Accounting)
12th Edition
ISBN: 9780134725987
Author: C. William Thomas, Wendy M. Tietz, Walter T. Harrison Jr.
Publisher: PEARSON
expand_more
expand_more
format_list_bulleted
Videos
Textbook Question
Chapter 12, Problem 12.6S
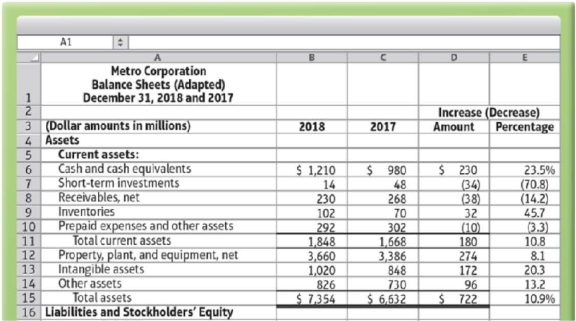
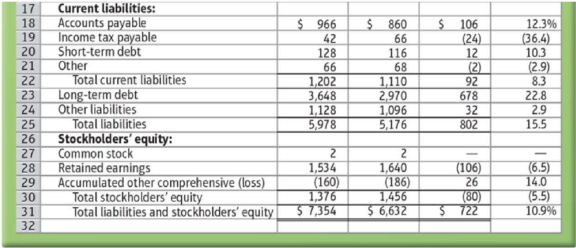
(Learning Objective 4: Evaluate a company’s quick ratio) To follow are the balance sheets for Metro Corporation and selected comparative competitor data.
| Company | Quick (acid-test) Ratio |
| Orleans Electric, Inc. (Utility)……………. | 0.74 |
| O’Neil Company (Department store)………….. | 0.63 |
| Lavallee Foods Corporation (Grocery store)……… | 0.66 |
Use the data to answer the following questions.
1. Calculate Metro’s quick (acid-test) ratio at December 31, 2018, and 2017.
2. Use the comparative information from the table given for Orleans Electric, Inc., O’Neil Company, and Lavallee Foods Corporation. Is Metro’s quick (acid-test) ratio for 2018 and 2017 strong, average, or weak in comparison?
Expert Solution & Answer
Want to see the full answer?
Check out a sample textbook solution
Students have asked these similar questions
Requirements:
a. Prepare horizontal analysis based on the above statements presented (for percent: round of your answers to 2 decimal places) Music Lover, Inc.xlsx
b. Evaluate the company's financial position and results of operation using the comparative statement analysis
i. Short-term solvency analysis
ii. Long-term financial position analysis iii. Operating efficiency and profitability analysis
OBJECTIVE: To enable learners to utilize financial ratios as a mechanism to evaluate the firm's financial
performance and identify areas for making decisions for improvement
REQUIREMENT: Financial Statement Analysis
Question
Refer to the following financial statements of Delima Corporation for 2019 and 2020:
Delima Corporation
Income Statements
For the year ended 31 December (in millions)
2020
$13,198
7,750
2019
$12,397
7,108
Net sales
Cost of goods sold
Gross profit
Selling and administrative expenses
Income from operations
5,448
5,289
3,472
3,299
1,976
1,990
Interest expense
233
248
Other (income) expense, net
11
1,732
503
1,229
Income before income taxes
1,742
Income tax expense
502
Net income
1,240
Delima Corporation
Balance Sheets
31 December (in millions)
2020
2019
Assets
Current assets
Cash
$460
$444
Accounts receivables (net)
1,188
1,132
1,190
1,056
225
2,915
3,128
Inventories
Other current assets
247
Total current assets
3,027
3,281
Property (net)
5,593
$11,901
Other assets…
Comparing Income Statements and Balance Sheets of CompetitorsFollowing are selected income statement and balance sheet data from two retailers: Abercrombie & Fitch (clothing retailer in the high-end market) and TJX Companies (clothing retailer in the value-priced market).
(a) Express each income statement amount as a percentage of sales.
Round your answers to one decimal place (ex: 0.2345 = 23.5%).
Income Statement
($ millions)
ANF
TJX
Sales
$4,680
$21,058
Cost of goods sold
1,599
Answer
16,021
Answer
Gross profit
3,081
Answer
5,037
Answer
Total expenses
2,435
Answer
4,003
Answer
Net income
$ 646
Answer
$ 1,034
Answer
(b) Express each balance sheet amount as a percentage of total assets.
Round your answers to one decimal place (ex: 0.2345 = 23.5%).
Balance Sheet
($ millions)
ANF
TJX
Current assets
$1,010
Answer
$3,929
Answer
Long-term assets
1,627
Answer
2,608
Answer
Total assets…
Chapter 12 Solutions
Financial Accounting (12th Edition) (What's New in Accounting)
Ch. 12 - Prob. 1QCCh. 12 - Prob. 2QCCh. 12 - Prob. 3QCCh. 12 - Prob. 4QCCh. 12 - Expressing accounts receivable as a percentage of...Ch. 12 - Kincaid Company reported the following data (in...Ch. 12 - Prob. 7QCCh. 12 - Ratios that measure liquidity include all of the...Ch. 12 - Verba Corporation has an inventory turnover of 15...Ch. 12 - The measure of a companys ability to collect cash...
Ch. 12 - A ratio that measures a companys profitability is...Ch. 12 - Prob. 12QCCh. 12 - Prob. 13QCCh. 12 - Prob. 14QCCh. 12 - Prob. 12.1ECCh. 12 - Prob. 12.1SCh. 12 - Prob. 12.2SCh. 12 - Prob. 12.3SCh. 12 - Prob. 12.4SCh. 12 - Prob. 12.5SCh. 12 - (Learning Objective 4: Evaluate a companys quick...Ch. 12 - Prob. 12.7SCh. 12 - (Learning Objective 4: Measure ability to pay...Ch. 12 - (Learning Objective 4: Measure profitability using...Ch. 12 - Prob. 12.10SCh. 12 - (Learning Objective 4: Use ratio data to...Ch. 12 - Prob. 12.12SCh. 12 - (Learning Objective 4: Analyze a company based on...Ch. 12 - Prob. 12.14SCh. 12 - Prob. 12.15SCh. 12 - Prob. 12.16AECh. 12 - Prob. 12.17AECh. 12 - Prob. 12.18AECh. 12 - Prob. 12.19AECh. 12 - Prob. 12.20AECh. 12 - Prob. 12.21AECh. 12 - Prob. 12.22AECh. 12 - Prob. 12.23AECh. 12 - Prob. 12.24AECh. 12 - Prob. 12.25AECh. 12 - Prob. 12.26AECh. 12 - Prob. 12.27BECh. 12 - Prob. 12.28BECh. 12 - Prob. 12.29BECh. 12 - Prob. 12.30BECh. 12 - Prob. 12.31BECh. 12 - LO 4 (Learning Objective 4: Calculate ratios;...Ch. 12 - Prob. 12.33BECh. 12 - Prob. 12.34BECh. 12 - Prob. 12.35BECh. 12 - Prob. 12.36BECh. 12 - Prob. 12.37BECh. 12 - Prob. 12.38QCh. 12 - Prob. 12.39QCh. 12 - Prob. 12.40QCh. 12 - Prob. 12.41QCh. 12 - Prob. 12.42QCh. 12 - Prob. 12.43QCh. 12 - Prob. 12.44QCh. 12 - Use the Orlando Medical Corporation financial...Ch. 12 - Prob. 12.46QCh. 12 - Use the Orlando Medical Corporation financial...Ch. 12 - Prob. 12.48QCh. 12 - Prob. 12.49QCh. 12 - Prob. 12.50QCh. 12 - Prob. 12.51QCh. 12 - Prob. 12.52QCh. 12 - Prob. 12.53QCh. 12 - Prob. 12.54QCh. 12 - Prob. 12.55QCh. 12 - LO 1, 2, 4 (Learning Objectives 1, 2, 4: Calculate...Ch. 12 - Prob. 12.57APCh. 12 - Prob. 12.58APCh. 12 - LO 4 (Learning Objective 4: Use ratios to evaluate...Ch. 12 - Prob. 12.60APCh. 12 - LO 2, 4, 5 (Learning Objectives 2, 4, 5: Analyze...Ch. 12 - Group B LO 1, 2, 4 (Learning Objectives 1, 2, 4:...Ch. 12 - Prob. 12.63BPCh. 12 - Prob. 12.64BPCh. 12 - LO 4 (Learning Objective 4: Use ratios to evaluate...Ch. 12 - Prob. 12.66BPCh. 12 - LO 2, 4, 5 (Learning Objectives 2, 4, 5: Analyze...Ch. 12 - Prob. 12.68CEPCh. 12 - Prob. 12.69CEPCh. 12 - (Learning Objectives 2, 3.4: Use trend...Ch. 12 - (Learning Objectives 4, 5: Calculate and analyze...Ch. 12 - Prob. 12.72DCCh. 12 - Prob. 12.73DCCh. 12 - Prob. 12.74EICCh. 12 - Focus on Financials Apple Inc. LO 1, 2, 3, 4, 5...Ch. 12 - Comprehensive Financial Statement Analysis Project...
Knowledge Booster


Learn more about
Need a deep-dive on the concept behind this application? Look no further. Learn more about this topic, accounting and related others by exploring similar questions and additional content below.Similar questions
- Use the following information to answer the questions that follow. A. Calculate the operating income percentage for each of the stores. Comment on how your analysis has changed for each store. B. Perform a vertical analysis for each store. Based on your analysis, what accounts would you want to investigate further? How might management utilize this information? C. Which method of analysis (using a dollar value or percentage) is most relevant and/or useful? Explain.arrow_forwardThe 2024 income statement of Adrian Express reports sales of $20,310,000, cost of goods sold of $12,500,000, and net income of $1,900,000. Balance sheet information is provided in the following table. Assets Current assets: Cash Accounts receivable Inventory ADRIAN EXPRESS Balance Sheets December 31, 2024 and 2023 Long-term assets Total assets Liabilities and Stockholders' Equity Current liabilities Long-term Liabilities Common stock Retained earnings Total liabilities and stockholders' equity Industry averages for the following four risk ratios are as follows: Gross profit ratio Return on assets Profit margin Asset turnover Return on equity 45% 25% 15% 6.5 35% tines 2024 2023 $800,000 $910,000 1,725,000 1,175,000 2,175,000 1,625,000 5,000,000 4,390,000 $9,700,000 $8,100,000 $2,030,000 $1,820,000 2,490,000 2,560,000 2,025,000 1,975,000 3,155,000 1,745,000 $9,700,000 $8,100,000arrow_forwardAy 1. Using your financial analysis of Gap Clothing company, Refer to the Annual Reports located in the Class Resources. You will use information in the Form 10-K to complete this assignment. Using the correct formulas and a separate tab for each analysis, calculate the following ratios using Microsoft Excel: Three liquidity ratios for the past 2 years Three solvency ratios for the past 2 years Three profitability ratios for the past 2 yearsarrow_forward
- Use the following selected data from Business Solutions's income statement for the three months ended March 31, 2022, and from its Complete this question by entering your answers in the tabs below. March 31, 2022, balance sheet to complete the requirements. Computer services revenue Net sales (of goods) Total sales and revenue Cost of goods sold. Net income Quick assets Current assets Total assets Current liabilities Total liabilities. Total equity Required 1 Required: 1. Compute the gross margin ratio (both with and without services revenue) and net profit margin ratio. 2. Compute the current ratio and acid-test ratio. 3. Compute the debt ratio and equity ratio. 4. What percent of its assets are current? What percent are long term? Required 2 Complete this question by entering your answers in the tabs below. $ 25,307 18,693 44,000 Required 3 Gross margin ratio Net profit margin ratio 14,052 18,833 90,924 95,568 120,268 875 875 119,393 % Compute the gross margin ratio (both with and…arrow_forwardVII. Direction: Compute and interpret. The following comparative financial statements are provided by Avatar Industries. You were asked to compute the different financial ratios and provide your interpretations with regards to profitability, efficiency, liquidity and solvency of the company. Use the Answer Sheet template below to input your answer and solution. AVATAR INDUSTRIES AVATAR INDUSTRIES Comparative Statement of Financial Position For the years 2019 and 2018 Comparative Income Statement For the years 2019 and 2018 2019 2018 2019 2018 ASSETS Current Assets: Sales P200,000 P210,000 Cash & Cash Equivalent P65,000 P70,000 Sales Returns and Allowances 40,000 25,000 Accounts Receivable 40,000 35,000 Net Sales 160,000 185,000 Marketable Secuities 40,000 35,000 Cost of Goods Sold 100,000 115,625 Inventory 100,000 80,000 Gross Profit 60,000 69,375 Total Current Assets 220,000 200,000 160,000 P445,000 P380,000 245,000 Operating Expenses: Fixed Assets Selling Expenses 22,000 25,000 Total…arrow_forwardVII. Direction: Compute and interpret. The following comparative financial statements are provided by Avatar Industries. You were asked to compute the different financial ratios and provide your interpretations with regards to profitability, efficiency, liquidity and solvency of the company. Use the Answer Sheet template below to input your answer and solution. AVATAR INDUSTRIES AVATAR INDUSTRIES Comparative Statement of Financial Position For the years 2019 and 2018 Comparative Income Statement For the years 2019 and 2018 2019 2018 2019 2018 ASSETS Current Assets: Sales P200,000 P210,000 Cash & Cash Equivalent P65,000 P70,000 Sales Returns and Allowances 40,000 25,000 Accounts Receivable 40,000 35,000 Net Sales 160,000 185,000 Marketable Securities 40,000 35,000 Cost of Goods Sold 100,000 115,625 Inventory 100,000 80,000 Gross Profit 60,000 69,375 Total Current Assets 245,000 220,000 Operating Expenses: Fixed Assets 200,000 160,000 Selling Expenses 22,000 25,000 Total Assets P445,000…arrow_forward
- Required Prepare a vertical analysis of both the balance sheets and income statements for Year 4 and Year 3. Complete this question by entering your answers in the tabs below. Analysis Bal Sheet Analysis Inc Stmt Prepare a vertical analysis of an income statements for Year 4 and Year 3. (Percentages may not add exactly due to rounding. Round your answers to 2 decimal places. (i.e., .2345 should be entered as 23.45).) ALLENDALE COMPANY Vertical Analysis of Income Statements Year 4 Year 3 Amount % Total Amount % Total Revenues Sales (net) $ 230,000 100.00 % $ 210,000 100.00 % Other revenues 8,000 5,000 Total revenues 238,000 215,000 Expenses Cost of goods sold 120,000 103,000 Selling, general, and administrative expense 55,000 50,000 Interest expense 8,000 7,200 Income tax expense 23,000 22,000 Total expenses 206,000 182,200 Net income $ 32,000 % $ 32,800 %arrow_forwardRequired Prepare a vertical analysis of both the balance sheets and income statements for Year 4 and Year 3. Complete this question by entering your answers in the tabs below. Analysis Bal Analysis Inc Sheet Stmt Prepare a vertical analysis of the balance sheets for Year 4 and Year 3. (Percentages may not add exactly due to rounding. Round your answers to 2 decimal places. (i.e., .2345 should be entered as 23.45).) ALLENDALE COMPANY Vertical Analysis of Balance Sheets Year 4 Year 3 Amount % Total Amount % Total Assets Current assets Cash $ 40,000 % $ 36,000 % Marketable securities 20,000 6,000 Accounts receivable (net) 54,000 46,000 Inventories 135,000 143,000 Prepaid items 25,000 10,000 Total current assets 274,000 241,000 Investments 27,000 20,000 Plant (net) 270,000 255,000 Land 29,000 24,000 Total long-term assets 326,000 299,000 Total assets $ 600,000 100.00 $ 540,000 100.00 Liabilities and stockholders' equity Liabilities Current liabilities Notes payable $ 17,000 $ 6,000…arrow_forwardRequired Prepare a vertical analysis of both the balance sheets and income statements for Year 4 and Year 3. Complete this question by entering your answers in the tabs below. Analysis Bal Analysis Inc Sheet Stmt Prepare a vertical analysis of the balance sheets for Year 4 and Year 3. (Percentages may not add exactly due to rounding. Round your answers to 2 decimal places. (i.e., .2345 should be entered as 23.45).) ALLENDALE COMPANY Vertical Analysis of Balance Sheets Year 4 Year 3 Amount Amount Assets Current assets Cash $ 40,000 $36,000 Marketable securities 20,000 6,000 Accounts receivable (net) 54,000 46,000 Inventories 135,000 143,000 Prepaid items 25,000 10,000 Total current assets 274,000 241,000 27,000 20,000 270,000 255,000 29,000 24,000 Total long-term assets 326,000 299,000 Total assets $ 600,000 $540,000 Liabilities and stockholders' equity Liabilities Current liabilities Notes payable $ 17,000 $ 6,000 Accounts payable 113,800 100,000 Salaries payable 21,000 15,000 151,800…arrow_forward
- In a minimum of 175 words Imagine that you’ve been asked to explain 1 of the major accounting ratios to a group of high school students who have no background in business or accounting but are eager to learn. Choose 1 of the following ratios and describe how you would explain it in your own words, using a specific example: current ratio asset turnover profit margin on salesarrow_forwardPlease take a look below at the two companies' financial ratios. Use the material your learned in the chapter to try and identify the industries these two companies operate in. You are going to be graded on the quality of your analysis and arguments (e.g. this ratio indicates that... and that ratio indicates the other,... and taken together these ratios indicate that.... (and so forth)) : Company A Company B P/E Ratio: 30 Price/Sales: 6 Price/Book Value of Equity: 7.5 Profit Margin: 20% Operating Margin: 25% Return on Assets (ROA): 6% Return On Equity (ROE): 25% Current Ratio: 3 P/E Ratio: 17 Price/Sales: 0.6 Price/Book Value of Equity: 3 Profit Margin: 3% Operating Margin: 5% Return on Assets (ROA): 7% Return On Equity (ROE): 15% Current Ratio: 1arrow_forwardCommon-Size Financial Statement Analysis Using Excel Completing this activity will help you learn to: 1. create Excel formulas using cell references. 2. create absolute cell references to perform calculations efficiently and correctly. 3. apply conditional formatting to highlight cells based on criteria that you specify. Case scenario: You are working at a small business that has been mostly stable. You want to analyze the financial statements of the past five years to examine the trends over time and compare the percentages of income statement items relative to overall sales. You also want to highlight cells according to whether the calculated ratio increases or decreases more than a specified amount. Required: Download spreadsheet CommonSizeCaseData-52d586.xlsx You will build a spreadsheet that performs common-size analysis using five years of a company's income statements. Specifically, you will create two sheets within the workbook, one for the horizontal analysis and one for the…arrow_forward
arrow_back_ios
SEE MORE QUESTIONS
arrow_forward_ios
Recommended textbooks for you
 Financial Accounting: The Impact on Decision Make...AccountingISBN:9781305654174Author:Gary A. Porter, Curtis L. NortonPublisher:Cengage Learning
 Principles of Accounting Volume 2AccountingISBN:9781947172609Author:OpenStaxPublisher:OpenStax College
Financial Accounting: The Impact on Decision Make...
Accounting
ISBN:9781305654174
Author:Gary A. Porter, Curtis L. Norton
Publisher:Cengage Learning
Principles of Accounting Volume 2
Accounting
ISBN:9781947172609
Author:OpenStax
Publisher:OpenStax College
How To Analyze an Income Statement; Author: Daniel Pronk;https://www.youtube.com/watch?v=uVHGgSXtQmE;License: Standard Youtube License