
Videos
(a)
To fit a straight line to the relationship of weight by year for Texas football players.
(a)
Answer to Problem 38RE
The line is
Explanation of Solution
It is given in the question the table which shows the average weight of the football team for the University of Texas for various years. Thus, to fit a straight line to the relationship of weight by year for Texas football players we will use Excel as we will first select the data in Excel and then go to the insert tab from where we will select the
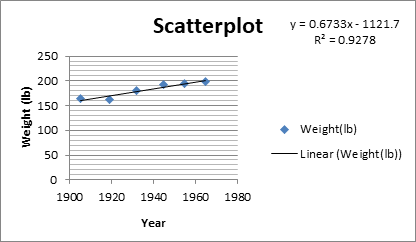
Thus, the equation of the regression line is:
(b)
To find out in what year will the predicted weight of the Williams college team from exercise
(b)
Answer to Problem 38RE
It will be in the year
Explanation of Solution
It is given in the question the table which shows the average weight of the football team for the University of Texas for various years. And the regression line is as:
Thus, we will predict weight of the Williams college team from exercise
(c)
To explain do you believe this.
(c)
Answer to Problem 38RE
No, we do not believe.
Explanation of Solution
It is given in the question the table which shows the average weight of the football team for the University of Texas for various years. And the regression line is as:
Thus, we do not believe in this because both the predictions of weights require extrapolating.
Chapter PII Solutions
Stats: Modeling the World Nasta Edition Grades 9-12
Additional Math Textbook Solutions
Statistics for Business and Economics (13th Edition)
STATS:DATA+MODELS-W/DVD
Essentials of Statistics, Books a la Carte Edition (5th Edition)
Elementary Statistics Using Excel (6th Edition)
Fundamentals of Statistics (5th Edition)


 MATLAB: An Introduction with ApplicationsStatisticsISBN:9781119256830Author:Amos GilatPublisher:John Wiley & Sons Inc
 Probability and Statistics for Engineering and th...StatisticsISBN:9781305251809Author:Jay L. DevorePublisher:Cengage Learning
 Statistics for The Behavioral Sciences (MindTap C...StatisticsISBN:9781305504912Author:Frederick J Gravetter, Larry B. WallnauPublisher:Cengage Learning
 Elementary Statistics: Picturing the World (7th E...StatisticsISBN:9780134683416Author:Ron Larson, Betsy FarberPublisher:PEARSON
 The Basic Practice of StatisticsStatisticsISBN:9781319042578Author:David S. Moore, William I. Notz, Michael A. FlignerPublisher:W. H. Freeman
 Introduction to the Practice of StatisticsStatisticsISBN:9781319013387Author:David S. Moore, George P. McCabe, Bruce A. CraigPublisher:W. H. Freeman