
Videos
(a)
To create a linear model to predict the number of gallons that will be available in
(a)
Answer to Problem 34RE
The regression line is
Explanation of Solution
It is given in the question that since clean air regulations have dictated the use of unleaded gasoline the supply of leaded gas in New York State has diminished. The table is given on the August New York State Math B exam, a state wide achievement test for high school students. Thus, for constructing a linear model we will use Excel as we will first select the data in Excel and then go to the insert tab from where we will select the
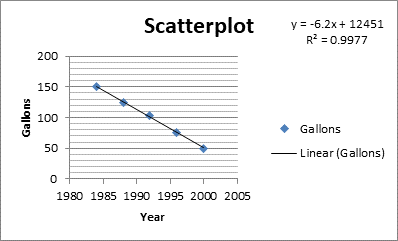
Thus, the regression line is as:
(b)
To explain why that method is incorrect.
(b)
Explanation of Solution
It is given in the question that since clean air regulations have dictated the use of unleaded gasoline the supply of leaded gas in New York State has diminished. The table is given on the August New York State Math B exam, a state wide achievement test for high school students. And the regression line is:
Since the exam asked the students to estimate the year when leaked gasoline will first become unavailable, expecting them to use the model from part (a) to answer the question so, we cannot use that model in part (a) because the model predicts gallons from year not the other way around.
(c)
To create a model that would be appropriate for that task and make the estimate.
(c)
Answer to Problem 34RE
The model is
Explanation of Solution
It is given in the question that since clean air regulations have dictated the use of unleaded gasoline the supply of leaded gas in New York State has diminished. The table is given on the August New York State Math B exam, a state wide achievement test for high school students. And the regression line is:
Thus, the model to predict the year from the gallons can be created by using Excel as we will first select the data in Excel and then go to the insert tab from where we will select the scatterplot option in the charts and when the scatterplot is constructed we will go to the design tab under the chart tools, from where we will select the quick layout option and select the layout with the equation option then the linear model is constructed in the scatterplot as:
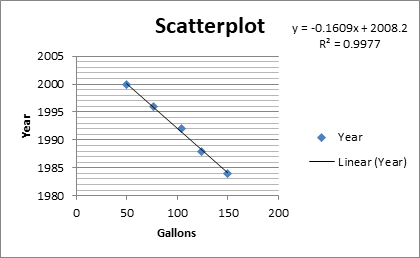
Thus, the linear model is as:
(d)
To explain why the wrong answer from the other model is fairly accurate in this case.
(d)
Explanation of Solution
It is given in the question that since clean air regulations have dictated the use of unleaded gasoline the supply of leaded gas in New York State has diminished. The table is given on the August New York State Math B exam, a state wide achievement test for high school students. Thus, the wrong answer from the other model is fairly accurate in this case because if we solve for the value it will be close but the model cannot predict changes.
Chapter PII Solutions
Stats: Modeling the World Nasta Edition Grades 9-12
Additional Math Textbook Solutions
Introductory Statistics (10th Edition)
Essentials of Statistics (6th Edition)
Statistics for Business and Economics (13th Edition)
Elementary Statistics
Basic Business Statistics, Student Value Edition (13th Edition)
Elementary Statistics: Picturing the World (7th Edition)


 MATLAB: An Introduction with ApplicationsStatisticsISBN:9781119256830Author:Amos GilatPublisher:John Wiley & Sons Inc
 Probability and Statistics for Engineering and th...StatisticsISBN:9781305251809Author:Jay L. DevorePublisher:Cengage Learning
 Statistics for The Behavioral Sciences (MindTap C...StatisticsISBN:9781305504912Author:Frederick J Gravetter, Larry B. WallnauPublisher:Cengage Learning
 Elementary Statistics: Picturing the World (7th E...StatisticsISBN:9780134683416Author:Ron Larson, Betsy FarberPublisher:PEARSON
 The Basic Practice of StatisticsStatisticsISBN:9781319042578Author:David S. Moore, William I. Notz, Michael A. FlignerPublisher:W. H. Freeman
 Introduction to the Practice of StatisticsStatisticsISBN:9781319013387Author:David S. Moore, George P. McCabe, Bruce A. CraigPublisher:W. H. Freeman