
Videos
(a)
To create a
(a)
Explanation of Solution
It is given in the question that the organization Kids Count monitors issues related to children and the table is also given which shows a
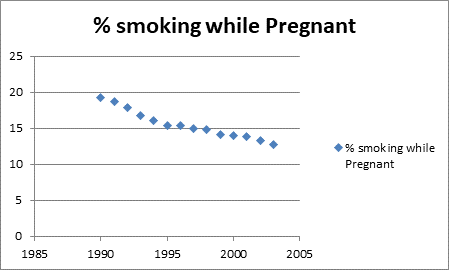
Thus, we can say by looking at the scatterplot that the points in the scatterplot is moving downward from left to right and the points are in a straight line, so the association between them is negative and linear in nature and also as time goes on the percentage of expectant mothers smoking decreases.
(b)
To find the
(b)
Answer to Problem 22RE
The correlation is
Explanation of Solution
It is given in the question that the organization Kids Count monitors issues related to children and the table is also given which shows a
Thus, the calculation for the correlation is as follows:
| Correlation= | =CORREL(C31:C44,D31:D44) |
Thus, the result for the correlation will be as:
| Correlation= | -0.972 |
(c)
To explain how is the value of the correlation affected by the fact that the data are averages rather than percentages for each of the
(c)
Answer to Problem 22RE
It will be strengthened.
Explanation of Solution
It is given in the question that the organization Kids Count monitors issues related to children and the table is also given which shows a
(d)
To write a linear model and interpret the slope in context.
(d)
Answer to Problem 22RE
The linear model is
Explanation of Solution
It is given in the question that the organization Kids Count monitors issues related to children and the table is also given which shows a
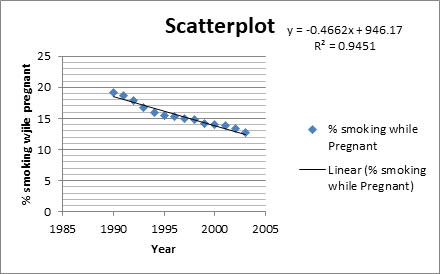
Thus, the linear model is:
Thus, the slope of the regression line is interpreted as that every year the percentage of smoking expectant mothers decreases by
Chapter PII Solutions
Stats: Modeling the World Nasta Edition Grades 9-12
Additional Math Textbook Solutions
An Introduction to Mathematical Statistics and Its Applications (6th Edition)
Elementary Statistics (13th Edition)
Introductory Statistics
Essentials of Statistics, Books a la Carte Edition (5th Edition)
Basic Business Statistics, Student Value Edition
Statistics: The Art and Science of Learning from Data (4th Edition)


 MATLAB: An Introduction with ApplicationsStatisticsISBN:9781119256830Author:Amos GilatPublisher:John Wiley & Sons Inc
 Probability and Statistics for Engineering and th...StatisticsISBN:9781305251809Author:Jay L. DevorePublisher:Cengage Learning
 Statistics for The Behavioral Sciences (MindTap C...StatisticsISBN:9781305504912Author:Frederick J Gravetter, Larry B. WallnauPublisher:Cengage Learning
 Elementary Statistics: Picturing the World (7th E...StatisticsISBN:9780134683416Author:Ron Larson, Betsy FarberPublisher:PEARSON
 The Basic Practice of StatisticsStatisticsISBN:9781319042578Author:David S. Moore, William I. Notz, Michael A. FlignerPublisher:W. H. Freeman
 Introduction to the Practice of StatisticsStatisticsISBN:9781319013387Author:David S. Moore, George P. McCabe, Bruce A. CraigPublisher:W. H. Freeman