
Introductory Statistics (10th Edition)
10th Edition
ISBN: 9780321989178
Author: Neil A. Weiss
Publisher: PEARSON
expand_more
expand_more
format_list_bulleted
Concept explainers
Videos
Textbook Question
Chapter C.1, Problem 15E
In each of Exercises C.11–C.17 identify the following:
- a. the response, variable
- b. the factors
- c. the levels of each factor
- d. the number of treatment combinations
- e. the experimental units
- f. the number of observations for each treatment combination
- g. the experimental factors, if any
- h. the classification factors, if any
- i. whether the study is a designed experiment or an observational study
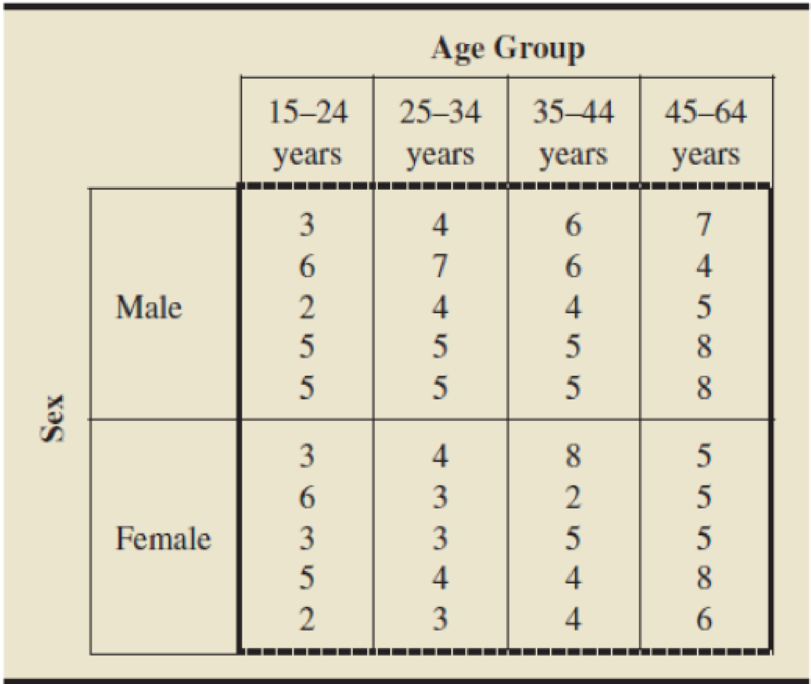
C.15 Hospital Stays. The U.S. National Center for Health Statistics collects data on length of stay in noninstitutional, short-stay hospitals by sex and age. Results are published in Vital and Health Statistics. Independent random samples of Americans were taken to compare the lengths of stay (in days) for males and females in four age groups (15–24 years, 25–34 years, 35–14 years, and 45–64 years). The data are in the following table.
Expert Solution & Answer
Want to see the full answer?
Check out a sample textbook solution
Students have asked these similar questions
Golden Torch Cacti Lengths. In their study of Golden Torch cacti, Feldman and Cross white investigated the total length of cuttings at the end of 16 months. Here are the data, in millimeters.
a. the response variable
b. the factors
c. the levels of each factor
d. the number of treatment combinations
e. the experimental units
f. the number of observations for each treatment combination
g. the experimental factors, if any
h. the classification factors, if any
i. whether the study is a designed experiment or an observational study
II. For each of the following variables, indicate whether it is qualitative or quantitative variables.
1. Scores in the board examinations
Blood type
3.
2.
Size of container
Postal zip codes
5. Income
4.
3. To determine what suitable teaching
techniques to use for the students with learning
disorder under the special education program of
a certain school, an IQ exam was administered
to selected students. Out of the 117 students
diagnosed with specific learning disorder, 50
students took the test to represent the total
population. Their IQ score was recorded to serve
as primary data.
A. Descriptive or Inferential
B. Population
C. Sample
D. Variable/s involved (Indicate the IV &
DV if possible)
E. Level of measurement (Variable/s)
4. A professor recorded the scores from prelim
exam as obtained by his students to characterize
their competency on the subject matter being
covered. Among his 8 sections (with 50 students
each), he included 15 students from each class
through systematic sampling. As a result, the
mean score of the selected students is 84 which
can be classified as average.
A. Descriptive or Inferential
B. Population
C. Sample
D. Variable/s involved (Indicate the IV &
DV if…
Chapter C Solutions
Introductory Statistics (10th Edition)
Ch. C.1 - Define the following terms: a. factor b. levels of...Ch. C.1 - A three-way factorial design has Factor A at 3...Ch. C.1 - A four-way factorial design has Factor A at 2...Ch. C.1 - A three-way factorial design has Factor A at 6...Ch. C.1 - Answer true or false to each of the following...Ch. C.1 - Prob. 8ECh. C.1 - Answer true or false to each of the following...Ch. C.1 - Prob. 10ECh. C.1 - In each of Exercises C.11C.17 identify the...Ch. C.1 - In each of Exercises C.11C.17 identify the...
Ch. C.1 - In each of Exercises C.11C.17 identify the...Ch. C.1 - In each of Exercises C.11C.17 identify the...Ch. C.1 - In each of Exercises C.11C.17 identify the...Ch. C.1 - Prob. 16ECh. C.1 - In each of Exercises C.11C.17 identify the...Ch. C.2 - Consider a 3 4 ANOVA. a. Identify the number of...Ch. C.2 - Consider a 4 2 ANOVA. a. Identify the number of...Ch. C.2 - Prob. 25ECh. C.2 - Prob. 26ECh. C.2 - Prob. 27ECh. C.2 - Prob. 28ECh. C.2 - In two-way ANOVA, identify what we mean by a. a...Ch. C.2 - In two-way ANOVA, what does it mean we have...Ch. C.2 - In Exercises C.31C.33, we have presented partially...Ch. C.2 - Prob. 32ECh. C.2 - Prob. 33ECh. C.2 - Prob. 34ECh. C.2 - State the null and alternative hypotheses for a...Ch. C.2 - Prob. 36ECh. C.2 - In a two-way ANOVA, why is the test for...Ch. C.2 - Prob. 38ECh. C.2 - Prob. 39ECh. C.2 - Prob. 40ECh. C.2 - Prob. 41ECh. C.2 - Referring to Exercise C.38, for which part(s) is...Ch. C.2 - Prob. 43ECh. C.2 - Prob. 44ECh. C.2 - Prob. 45ECh. C.2 - Prob. 46ECh. C.3 - In each of Exercises C.47C.53, we have presented a...Ch. C.3 - In each of Exercises C.47C.53, we have presented a...Ch. C.3 - Prob. 49ECh. C.3 - Prob. 50ECh. C.3 - Prob. 51ECh. C.3 - Prob. 52ECh. C.3 - Prob. 53ECh. C.3 - Prob. 54ECh. C.3 - Prob. 55ECh. C.3 - Prob. 56ECh. C.3 - Prob. 57ECh. C.3 - Prob. 58ECh. C.3 - Prob. 59ECh. C.3 - Prob. 60ECh. C.3 - Prob. 61ECh. C.3 - Prob. 62ECh. C.3 - Prob. 63ECh. C.3 - Prob. 64ECh. C.3 - Prob. 65ECh. C.3 - Prob. 66ECh. C.3 - Prob. 67ECh. C.3 - Prob. 68ECh. C.3 - Prob. 69ECh. C.3 - Prob. 70ECh. C.3 - Prob. 71ECh. C.4 - In an experiment with two factors, A and B, what...Ch. C.4 - If the confidence interval for the difference...Ch. C.4 - Prob. 74ECh. C.4 - Prob. 75ECh. C.4 - Let Factor A have three levels and Factor B have...Ch. C.4 - In Exercises C.77C.83, we have repeated the...Ch. C.4 - Prob. 78ECh. C.4 - In Exercises C.77C.83, we have repeated the...Ch. C.4 - Prob. 80ECh. C.4 - In Exercises C. 77-C.83. we have repeated the...Ch. C.4 - In Exercises C.77C.83, we have repeated the...Ch. C.4 - Prob. 83ECh. C.4 - Household Income. Refer to Exercise C.77. Use the...Ch. C.4 - Prob. 85ECh. C.4 - Prob. 86ECh. C.4 - Highway Signs. Refer to Exercise C.80. Use the...Ch. C.4 - Hospital Stays. Refer to Exercise C.81. Use the...Ch. C.4 - Prob. 89ECh. C.4 - Advertising and Sales. Refer to Exercise C.83. Use...Ch. C.5 - In each of Exercises C.91C.97, identify the...Ch. C.5 - Prob. 92ECh. C.5 - In each of Exercises C.91C.97, identify the...Ch. C.5 - In each of Exercises C.91C.97, identify the...Ch. C.5 - In each of Exercises C.91C.97, identify the...Ch. C.5 - In each of Exercises C.91C.97, identify the...Ch. C.5 - In each of Exercises C.91C.97, identify the...Ch. C.6 - What is the purpose of blocking in a randomized...Ch. C.6 - Prob. 104ECh. C.6 - Prob. 105ECh. C.6 - Prob. 106ECh. C.6 - Answer true or false to the following statements...Ch. C.6 - Prob. 108ECh. C.6 - In randomized block ANOVA, what is meant when we...Ch. C.6 - Prob. 110ECh. C.6 - State the null and alternative hypotheses for a...Ch. C.6 - Identify, give the degrees of freedom for, and...Ch. C.6 - Prob. 113ECh. C.6 - Prob. 114ECh. C.6 - Prob. 115ECh. C.6 - Prob. 116ECh. C.6 - Prob. 117ECh. C.6 - Prob. 118ECh. C.7 - In each of Exercises C.119C.125, we have presented...Ch. C.7 - Prob. 120ECh. C.7 - Prob. 121ECh. C.7 - Prob. 122ECh. C.7 - Prob. 123ECh. C.7 - Prob. 124ECh. C.7 - Prob. 125ECh. C.7 - Prob. 126ECh. C.7 - Prob. 127ECh. C.7 - Prob. 128ECh. C.7 - Prob. 129ECh. C.7 - Prob. 130ECh. C.7 - Prob. 131ECh. C.7 - Penicillin Yields. Refer to Exercise C.121. Use...Ch. C.7 - Prob. 133ECh. C.7 - Battery Lifetimes. Refer to Exercise C.123. Use...Ch. C.7 - Prob. 135ECh. C.7 - Prob. 136ECh. C.7 - Prob. 137ECh. C.7 - Prob. 138ECh. C.7 - Prob. 139ECh. C.7 - Prob. 140ECh. C.7 - Prob. 141ECh. C.7 - Golf Ball Driving Distances. Refer to Exercise...Ch. C.7 - Prob. 143ECh. C.7 - Analgesic Effectiveness. Refer to the analgesic...Ch. C.8 - In a randomized block experiment with treatment...Ch. C.8 - If the confidence interval for the difference...Ch. C.8 - The parameter v for the q-curve in a Tukey...Ch. C.8 - Prob. 148ECh. C.8 - Prob. 149ECh. C.8 - Prob. 150ECh. C.8 - Prob. 151ECh. C.8 - Prob. 152ECh. C.8 - Prob. 153ECh. C.8 - Prob. 154ECh. C.8 - Mileage for Gasoline Brands. Refer to Exercises...Ch. C.8 - Prob. 156ECh. C.8 - Prob. 157ECh. C.8 - Barley Variety Yields. Refer to Exercises C.125...Ch. C.8 - Prob. 159ECh. C.9 - Of which test is the Friedman test a nonparametric...Ch. C.9 - Prob. 161ECh. C.9 - Prob. 162ECh. C.9 - Prob. 163ECh. C.9 - Fill in the following blank: If the null...Ch. C.9 - Prob. 165ECh. C.9 - For a Friedman test to compare the means of six...Ch. C.9 - Prob. 167ECh. C.9 - In each of Exercises C.168C.I74, determine whether...Ch. C.9 - Prob. 169ECh. C.9 - Prob. 170ECh. C.9 - Prob. 171ECh. C.9 - Prob. 172ECh. C.9 - Prob. 173ECh. C.9 - Prob. 174ECh. C.9 - Prob. 175ECh. C.9 - Prob. 176ECh. C.9 - Prob. 177ECh. C.9 - Prob. 178ECh. C.9 - Prob. 179ECh. C.9 - Prob. 180ECh. C.9 - Prob. 181ECh. C - Discuss the differences between a designed...Ch. C - In a complete factorial design, how do you...Ch. C - Prob. 3RPCh. C - Prob. 4RPCh. C - Prob. 5RPCh. C - Prob. 6RPCh. C - Prob. 7RPCh. C - For a two-way ANOVA: a. List and interpret the...Ch. C - Prob. 9RPCh. C - Prob. 10RPCh. C - State the assumptions for a two-way ANOVA and...Ch. C - Prob. 12RPCh. C - Prob. 13RPCh. C - Prob. 14RPCh. C - This problem concerns multiple comparisons. a....Ch. C - Cereal Sales. Refer to Problem 13. Perform...Ch. C - Explain why it is sometimes preferable to employ a...Ch. C - For a randomized block ANOVA: a. List and...Ch. C - Prob. 19RPCh. C - Prob. 20RPCh. C - Prob. 21RPCh. C - Prob. 22RPCh. C - Prob. 23RPCh. C - Prob. 24RPCh. C - Prob. 25RPCh. C - Identify the nonparametric alternative to the...Ch. C - Explain the logic behind the Friedman test.Ch. C - Prob. 28RPCh. C - Prob. 29RPCh. C - Prob. 30RPCh. C - Prob. 31RPCh. C - Prob. 32RPCh. C - Prob. 33RPCh. C - Prob. 34RPCh. C - Prob. 35RPCh. C - Prob. 36RP
Knowledge Booster


Learn more about
Need a deep-dive on the concept behind this application? Look no further. Learn more about this topic, statistics and related others by exploring similar questions and additional content below.Similar questions
- 1. A survey records several variables of interest to the researchers conducting a survey using the National College Health Assessment (NCHA). The following are some of the variables from a survey conducted at a small university. Which of the variables is a categorical? a.Cumulative grade point average b. Weight c. Race/ethnicity d.None of the abovearrow_forwardE. Identify the most appropriate methods of collecting data to be used in each of the following research topic. Choose your answer below and write the letter on the space provided. A. Interview B. Survey C. Observation D. Registration/census E. Experimentation 1. The effectiveness of Filipino as medium of instruction in teaching mathematics. 2. The changes in the behavior of drug dependents. 3. The physical and behavioral changes in a guinea pig subjected to a new medicine of SARS. 4. The number of private and public utility vehicles in the country. 5. The reaction of some celebrities to the announcement of the presidential bid of an actor. 6. The recreational activities of third year students and its relative effects on their study habits. 7. The values that are acquired by some teachers from watching Korean dramas. 8. The learning styles of students. 9. The characteristics, problems, and needs of the Filipino people. 10. The average temperature in Baguio City from December 1 to…arrow_forwardDetermine which of the following variables are quantitative. A: Rating of the effectiveness of a new cold remedy (Not effective, Somewhat effective, Very effective) B: Amount of time spent assembling a five-shelf bookcase. C. Number of children in a family. Group of answer choices A and B and C B and C A and C A and Barrow_forward
- 15 tape-recorders were examined for quality control test. The number of defects in each tape-recorder is recorded below. Draw the appropriate control chart and comment on the state of control. Unit no. (i): 1 2 3 4 7 8. 10 11 12 13 14 15 No. of defects (c): 2 4 3 1 1 2 7 3 1 4 2 1arrow_forwardDescribe as specifically as possible the following for this study: 1.Observational Unit 2.Experimental Unit 3.Variables - Specify which are quantitative and which are categorical and furtherclassify each as Nominal, Ordinal, Interval, or Ratio. Specify which are explanatoryand which are response variables.arrow_forwardMercury in Sushi An FDA guideline is that the mercury in fish should be below 1 part per million (ppm). Listed below are the amounts of mercury (ppm) found in tuna sushi sampled at different stores in New York City. The study was sponsored by the New York Times, and the stores (in order) are D’Agostino, Eli’s Manhattan, Fairway, Food Emporium, Gourmet Garage, Grace’s Marketplace, and Whole Foods. Construct a 98% confidence interval estimate of the mean amount of mercury in the population. Does it appear that there is too much mercury in tuna sushi?arrow_forward
arrow_back_ios
arrow_forward_ios
Recommended textbooks for you
 Glencoe Algebra 1, Student Edition, 9780079039897...AlgebraISBN:9780079039897Author:CarterPublisher:McGraw Hill
Glencoe Algebra 1, Student Edition, 9780079039897...
Algebra
ISBN:9780079039897
Author:Carter
Publisher:McGraw Hill
Sampling Methods and Bias with Surveys: Crash Course Statistics #10; Author: CrashCourse;https://www.youtube.com/watch?v=Rf-fIpB4D50;License: Standard YouTube License, CC-BY
Statistics: Sampling Methods; Author: Mathispower4u;https://www.youtube.com/watch?v=s6ApdTvgvOs;License: Standard YouTube License, CC-BY