
Concept explainers
Videos
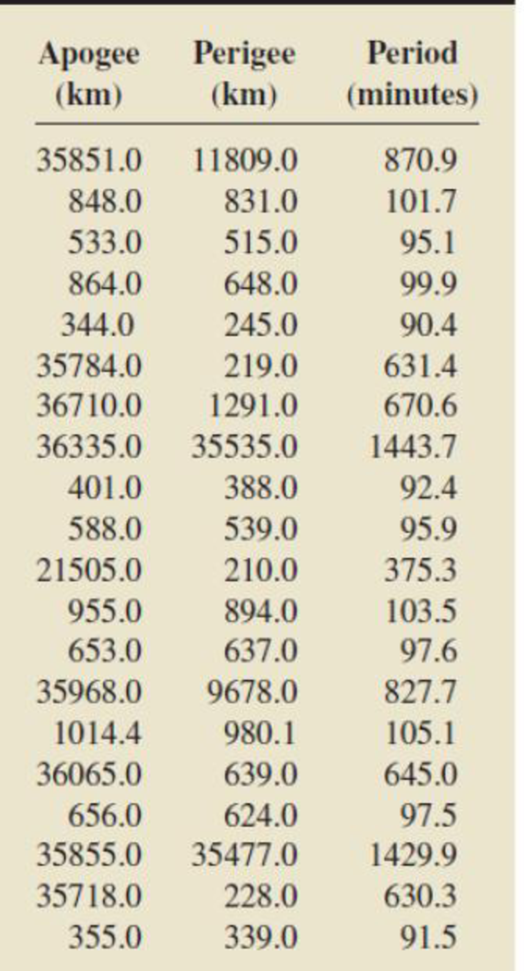
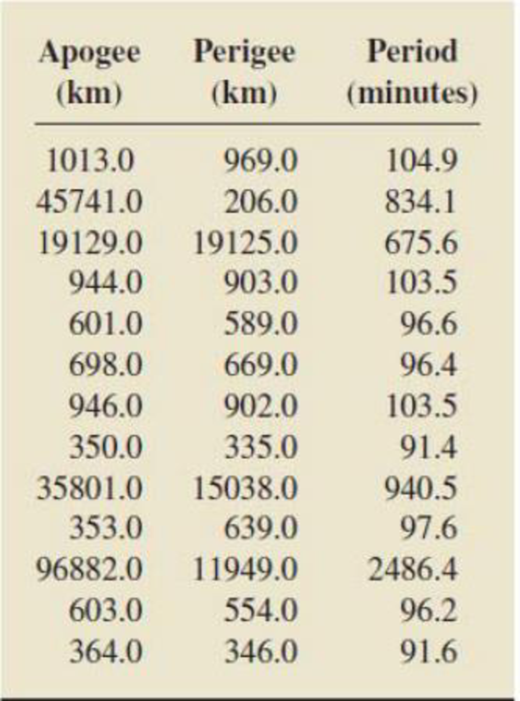
Satellite Orbits. Each issue of the magazine Ad Astra presents a list of space satellites that are launched into earth orbit during a two-month period. Also provided are the period of the satellite (time required to make one orbit of the earth), the apogee of the satellite (maximum distance from the earth), and the perigee of the satellite (minimum distance from the earth). The table below displays data on satellites placed in earth orbit from November 1998 through April, 1999 (Ad Astra, 11, Numbers 2, 3, 4). Multiple satellites placed in the same orbit during a single launch are listed as one observation only. We want to develop a second-order polynomial regression equation relating satellite period to apogee and perigee. (Readers interested in astronomy should investigate why this is an appropriate model.) Use the technology of your choice to do the following.
- a. Obtain a
scatterplot matrix for the observed values of period, apogee, and perigee. What do these plots indicate about the relationship between period and apogee? between period and perigee? - b. Obtain a three-dimensional scatterplot of period versus apogee and perigee. What does this plot indicate about the relationship between period and the two predictor variables apogee and perigee?
- c. Obtain the
correlation coefficients between period and the first- and second-order terms in the centered predictor variables apogeec and perigeec. Which terms are most highly correlated with period? What are the correlation coefficients between the first- and second-order terms? Will thesecorrelations adversely affect the ability to assess the effect of a term in the presence of the other terms? Explain your answer. - d. Perform a second-order polynomial
regression analysis for period using the centered predictor variables apogeec and perigeec. Based on the t-tests for the individual utility of each term in the model, which terms would you retain in the regression equation? Is it appropriate to use the t-tests here?
- e. Obtain plots of residuals versus fitted values, residuals versus apogeeC, and residuals versus perigeec, and also a normal probability plot of the residuals. Assess the appropriateness of the second-order polynomial regression equation, the assumption of constant conditional standard deviations, and the assumption of normality of the conditional distributions. Check for outliers and influential observations.
- f. Does your analysis in part (e) reveal any violations of the assumptions for regression inferences? Explain.
- g. Would it be appropriate to use the second-order polynomial regression equation obtained here to predict the period of the moon? Explain your answer.

Learn your wayIncludes step-by-step video

Chapter B Solutions
Introductory Statistics (10th Edition)
Additional Math Textbook Solutions
Fundamentals of Statistics (5th Edition)
Basic Business Statistics, Student Value Edition (13th Edition)
Statistical Reasoning for Everyday Life (5th Edition)
STATS:DATA+MODELS-W/DVD
Elementary Statistics


- A researcher studies water clarity at the same location in a lake on the same dates during the course of a year and repeats the measurements on the same dates 5 years later. The researcher immerses a weighted disk painted black and white and measures the depth (in inches) at which it is no longer visible. The collected data is given in the table below. Complete parts (a) through (c) below. Observation 1 2 3 4 5 6 Date 1/25 3/19 5/30 7/3 9/13 11/7 Initial Depth, X; 37.2 43.4 47.7 67.2 49.7 53.3 Depth Five Years Later, Y; 44.4 43.2 52.4 71.0 55.9 55.4 a) Why is it important to take the measurements on the same date? O A. Using the same dates makes it easier to remember to take samples. e O B. Using the same dates makes the second sample dependent on the first and reduces variability in water clarity attributable to date. O C. Those are the same dates that all biologists use to take water clarity samples O D. Using the same dates maximizes the difference in water clarity. b) Does the…arrow_forwardA researcher studies water clarity at the same location in a lake on the same dates during the course of a year and repeats the measurements on the same dates 5 years later. The researcher immerses a weighted disk painted black and white and measures the depth (in inches) at which it is no longer visible. The collected data is given in the table below. Complete parts (a) through (c) below. Observation 1 2 3 4 5 6 3/19 5/30 7/3 9/13 11/77 1/25 71.2 35.6 53.8 41.2 57.3 43.4 72.1 35.1 59.0 41.0 61.0 47.0 Date Initial Depth, X, Depth Five Years Later, Y, Click the icon to view the table of critical t-values. (a) Why is it important to take the measurements on the same date? OA. Using the same dates makes it easier to remember to take samples. B. Those are the same dates that all biologists use to take water clarity samples. C. Using the same dates makes the second sample dependent on the first and reduces variability in water clarity attributable to date. D. Using the same dates maximizes…arrow_forwardA researcher studies water clarity at the same location in a lake on the same dates during the course of a year and repeats the measurements on the same dates 5 years later. The researcher immerses a weighted disk painted black and white and measures the depth (in inches) at which it is no longer visible. The collected data is given in the table below. Complete parts (a) through (c) below. Observation 1 2 3 4 5 6 3/19 5/30 7/3 9/13 1/25 41.6 72.7 72.4 65.9 49.3 72.1 11/7 64.2 68.6 76.6 69.4 69.8 70.5 Date Initial Depth, X₁ Depth Five Years Later, Y; B. Using the same dates maximizes the difference in water clarity. C. Those are the same dates that all biologists use to take water clarity samples. D. Using the same dates makes the second sample dependent on the first and reduces variability in water clarity attributable to date. b) Does the evidence suggest that the clarity of the lake is improving at the α = 0.05 level of significance? Note that the normal probability plot and boxplot…arrow_forward
- A researcher studies water clarity at the same location in a lake on the same dates during the course of a year and repeats the measurements on the same dates 5 years later. The researcher immerses a weighted disk painted black and white and measures the depth (in inches) at which it is no longer visible. The collected data is given in the table below. Complete parts (a) through (c) below. Observation 4 5 6 1 2 3 1/25 3/19 5/30 7/3 9/13 11/7 35.6 53.8 41.2 57.3 43.4 72.1 35.1 59.0 41.0 61.0 71.2 47.0 Date Initial Depth, X₁ Depth Five Years Later, Y₁ Click the icon to view the table of critical t-values. ... (a) Why is it important to take the measurements on the same date? OA. Using the same dates makes it easier to remember to take samples. OB. Those are the same dates that all biologists use to take water clarity samples. C. Using the same dates makes the second sample dependent on the first and reduces variability in water clarity attributable to date. OD. Using the same dates…arrow_forwardNeed help with the forecast for year 4arrow_forwardA researcher studies water clarity at the same location in a lake on the same dates during the course of a year and repeats the measurements on the same dates 5 years later. The researcher immerses a weighted disk painted black and white and measures the depth (in inches) at which it is no longer visible. The collected data is given in the table below. Complete parts (a) through (c) below. Observation 1 2 3 4 5 6 1/25 3/19 5/30 7/3 9/13 11/7 41.6 72.7 72.4 65.9 64.2 68.6 49.3 72.1 76.6 69.4 69.8 70.5 Date Initial Depth, X¡ Depth Five Years Later, Y; What is your conclusion regarding Ho? A. Do not reject Ho. There is not sufficient evidence at the α = 0.05 level of significance to conclude that the clarity of the lake is improving. B. Do not reject Ho. There is sufficient evidence at the x = 0.05 level of significance to conclude that the clarity of the lake is improving. C. Reject Ho. There is sufficient evidence at the x = 0.05 level of significance to conclude that the clarity of the…arrow_forward
- A researcher studies water clarity at the same location in a lake on the same dates during the course of a year and repeats the measurements on the same dates 5 years later. The researcher immerses a weighted disk painted black and white and measures the depth (in inches) at which it is no longer visible. The collected data is given in the table below. Complete parts (a) through (c) below. Observation 1 2 3 4 5 6 1/25 3/19 5/30 7/3 9/13 11/7 41.6 72.7 72.4 65.9 64.2 68.6 49.3 72.1 76.6 69.4 69.8 70.5 Date Initial Depth, X, Depth Five Years Later, Y, ... a) Why is it important to take the measurements on the same date? OA. Using the same dates makes it easier to remember to take samples. B. Using the same dates maximizes the difference in water clarity. OC. Those are the same dates that all biologists use to take water clarity samples. D. Using the same dates makes the second sample dependent on the first and reduces variability in water clarity attributable to date. b) Does the…arrow_forwardA researcher studies water clarity at the same location in a lake on the same dates during the course of a year and repeats the measurements on the same dates 5 years later. The researcher immerses a weighted disk painted black and white and measures the depth (in inches) at which it is no longer visible. The collected data is given in the table below. Complete parts (a) through (c) below. Observation 1 2 3 4 5 6 1/25 3/19 5/30 7/3 9/13 11/7 Date Initial Depth, X, Depth Five Years Later, Y, Click the icon to view the table of critical t-values. 4 71.2 35.6 53.8 41.2 57.3 43.4 72.1 35.1 59.0 41.0 61.0 47.0 (a) Why is it important to take the measurements on the same date? OA. Using the same dates makes it easier to remember to take samples. OB. Those are the same dates that all biologists use to take water clarity samples. OC. Using the same dates makes the second sample dependent on the first and reduces variability in water clarity attributable to date. OD. Using the same dates…arrow_forwardA researcher studies water clarity at the same location in a lake on the same dates during the course of a year and repeats the measurements on the same dates 5 years later. The researcher immerses a weighted disk painted black and white and measures the depth (in inches) at which it is no longer visible. The collected data is given in the table below. Complete parts (a) through (c) below. Observation 1 2 3 4 5 6 1/25 3/19 5/30 713 9/13 11/7 37.2 47.1 55.5 49.3 67.3 68.1 44.0 46.6 59.9 51.4 73.5 70.2 Date Initial Depth, X₁ Depth Five Years Later, Y; a) Why is it important to take the measurements on the same date? ▶ OA. Using the same dates makes it easier to remember to take samples. OB. Using the same dates makes the second sample dependent on the first and reduces variability in water clarity attributable to date. OC. Those are the same dates that all biologists use to take water clarity samples. OD. Using the same dates maximizes the difference in water clarity. b) Does the…arrow_forward
- A researcher studies water clarity at the same location in a lake on the same dates during the course of a year and repeats the measurements on the same dates 5 years later. The researcher immerses a weighted disk painted black and white and measures the depth (in inches) at which it is no longer visible. The collected data is given in the table below. Complete parts (a) through (c) below. Observation 1 2 3 4 5 6 1/25 3/19 5/30 7/3 9/13 11/7 71.2 35.6 53.8 41.2 57.3 43.4 72.1 35.1 59.0 41.0 61.0 47.0 Date Initial Depth, X, Depth Five Years Later, Y, Click the icon to view the table of critical t-values. (a) Why is it important to take the measurements on the same date? OA. Using the same dates makes it easier to remember to take samples. B. Those are the same dates that all biologists use to take water clarity samples. C. Using the same dates makes the second sample dependent on the first and reduces variability in water clarity attributable to date. D. Using the same dates maximizes…arrow_forwardA researcher studies water clarity at the same location in a lake on the same dates during the course of a year and repeats the measurements on the same dates 5 years later. The researcher immerses a weighted disk painted black and white and measures the depth (in inches) at which it is no longer visible. The collected data is given in the table below. Complete parts (a) through (c) below Observation 3 4 Date 1/25 3/19 5/30 7/3 9/13 11/7 Initial Depth, X, 57.1 67.5 70.3 41.2 70.9 44.3 Depth Five Years Later, Y, 54.6 67.7 67.4 41.9 66.6 47.6 a) Why is it important to take the measurements on the same date? O A. Those are the same dates that all biologists use to take water clarity samples. O B. Using the same dates maximizes the difference in water clarity. O C. Using the same dates makes it easier to remember to take samples. O D. Using the same dates makes the second sample dependent on the first and reduces variability in water clarity attributable to date. b) Does the evidence…arrow_forward
 Algebra & Trigonometry with Analytic GeometryAlgebraISBN:9781133382119Author:SwokowskiPublisher:Cengage