
Concept explainers
Videos
OUTPUT B.95 Output for Problem 10
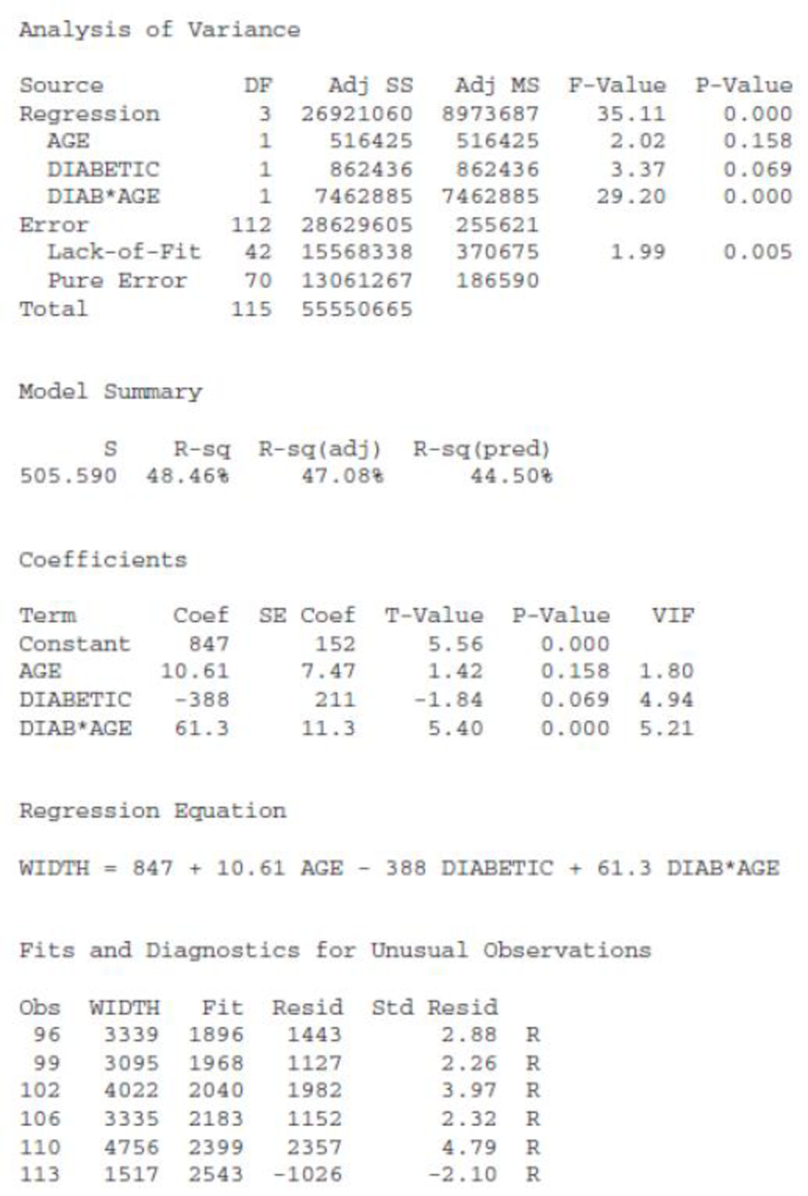
R Large residual
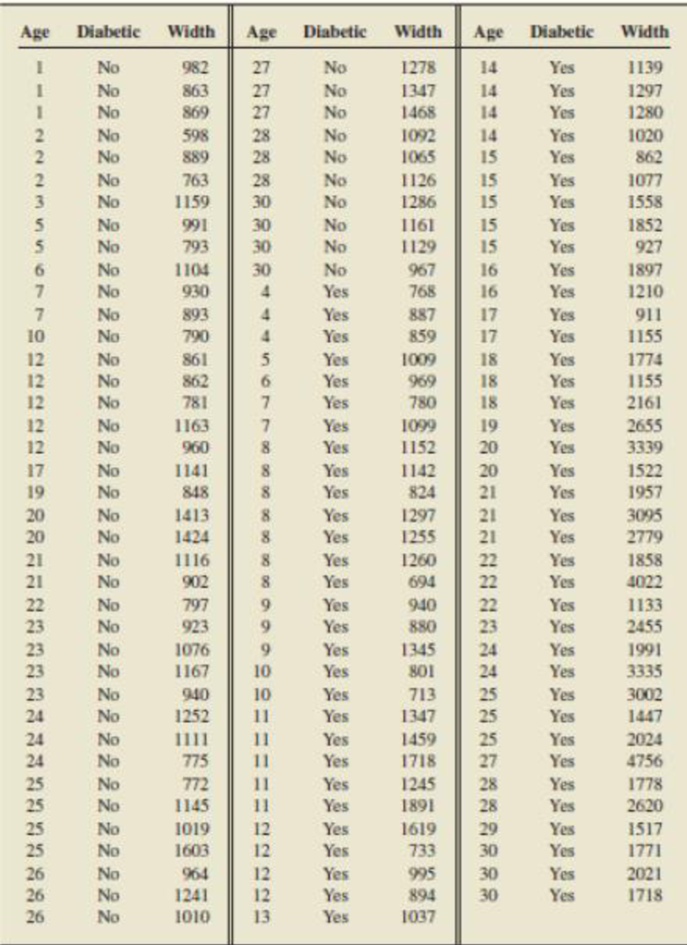
10. Diabetes. In the research article “Capillary Basement Membrane Width in Diabetic Children" (American Journal of Medicine, 58. pp. 365–372), P. Raskin et al. obtained data on age and on width of the quadriceps muscle capillary basement membrane of individuals with and without diabetes. The membrane width can be used to diagnose the presence of diabetic microangiopathy. The table below provides the data obtained by the researchers. We want to predict membrane width based on age and whether the person is a diabetic. We introduce the indicator variable diabetic defined by
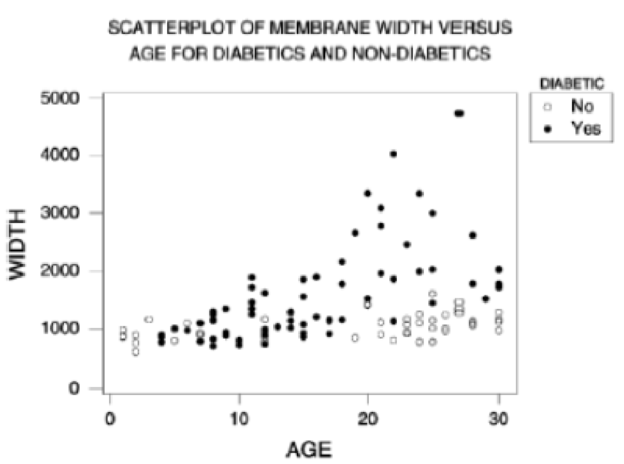
- a. Output B .91 on page B-170 shows a plot of width versus age, with the plot symbol being a solid black circle for diabetics and an open circle for non-diabetics. Based on this plot does it appear that diabetic is a useful predictor variable? Explain your answer.
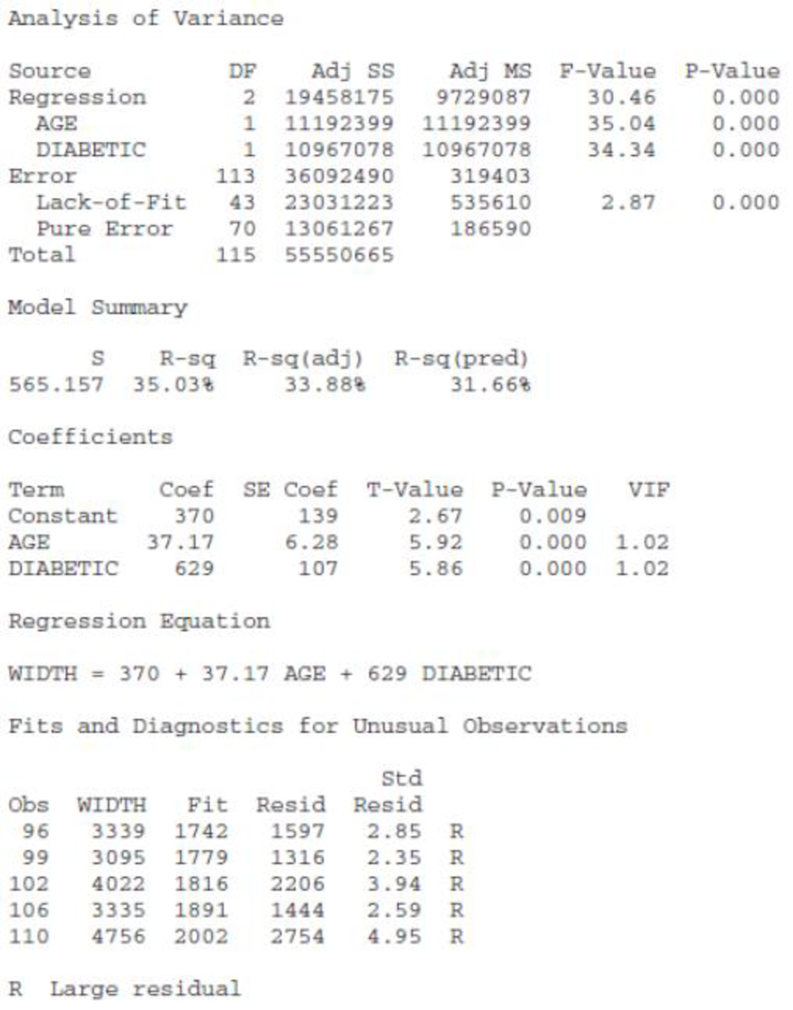
- b. We obtained the regression analysis of width on age and diabetic shown in Output B.92 on page B-170. Conduct the t-tests for the individual utility of each of the two predictor variables. Use a 5% level of significance and interpret your results.
- c. Based on Output B.92, obtain the regression equations relating width to age for diabetics and non-diabetics, separately.
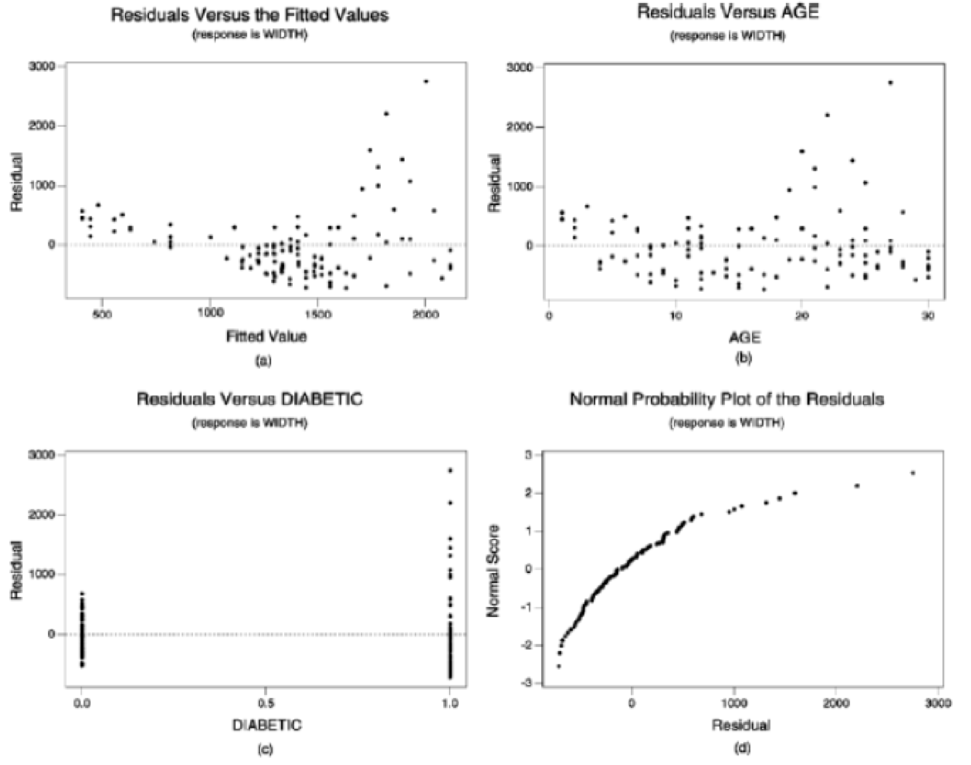
- d. Outputs B.93(a), (b), (c), and (d), given on page B-171, provide, respectively, plots of residuals versus fitted values, residuals versus age, residuals versus diabetic, and a normal probability plot of the residuals. Perform a residual analysis to assess the appropriateness of the regression equation, constancy of the conditional standard deviations, and normality of the conditional distributions. Check for outliers and influential observations.
Table for Problem 10
OUTPUT B.91
OUTPUT B.92 Output for Problem 10
Regression Analysis: WIDTH versus AGE, DIABETIC
OUTPUT B.93 Residual plots for Problem 10
- e. Output B.94 provides a plot of width versus age with regression lines for diabetics and non-diabetics. Based on this output and your residual analysis in part (d), do you feel that the model fits the data well? Explain your answer.
- f. To check for interaction between the two predictor variables, we obtained the regression analysis of width on age, diabetic, and diabetic-age. The output is given in Output B.95 on page B-172. Is there an interaction between age and diabetic? Use α = 0.05.
- g. What other analyses should be performed on these data? Explain your answer.
Want to see the full answer?
Check out a sample textbook solution
Chapter B Solutions
Introductory Statistics (10th Edition)


- 3. Wine Participant magazine has collected average price per bottle for the prestigious Chateau Le Thundebird bordeaux for different vintages (years). The data appears in the table below. year of bottling price a) draw the scatter diagram showing how wine price varies by vintage year b) use the most appropriate regression equation to determine the relationship between year of bottling (age) and price. c) what is the explanatory power (RSQ) of that equation d) determine the predicted price of a bottle of this wine for the 2017 vintage. 2009 36 2010 40 2011 51 2012 60 2013 68 2014 72 2015 70 2016 65 2018 51 2019 44 2020 39arrow_forwardThe model developed from sample data that has the form of Yhat = bo +bjX is known as the multiple regression model with two predictor variables. (True or False) O True O Falsearrow_forwardShow that an interaction term of a dummy variable and a regressor changes the slope of a regression line..arrow_forward
- An articie in Technometrics by S.C. Narula and J. F. Wallington Prediction, Lincar Regression, and a Minimum Sum of Relative Errors" Vol. 19, 1977) presents data on the sallingprica (y) and annual taas (x) for 24 houses. The taxes include local, school and county taxes. The data are shown in the following table. Sale Price/1000 Taxas/1000 25.9 4.9176 29.5 5.0208 27.9 4.5429 25.9 4.5573 29.9 5.0597 29.9 3.8910 30.9 5.8980 28.9 5.6039 35.9 5.8282 31.5 5.3003 31.0 6.2712 30.9 5.9592 30.0 5.0500 36.9 8.2464 41.9 6.6969 40.5 7.7841 43.9 9.0384 37.5 5.9894 37.9 7.5422 44.5 8.7951 37.9 6.0831 38.9 8.3607 36.9 8.1400 45.8 9.1416 (a) Calculate the least squares estimates of the slops and intercspt. (Round your answer to 3 decimal places.) (Round your answer to 2 decimal places.) (b) Find the mean selling price given that the taxes paid arex-8.9. (Round your answer to 2 decimal places.)arrow_forwardA) A multiple regression model was used in production the speed of a car based on several factors known to affect the speed. A graph of the residuals for the predicted values is presented below. i) Discuss the relevance of the graph shown below in relation to the normality of predicted values. 6.00000- 4.00000- 225 2.00000 00000- -2.00000- 424 164 226 227 O163 -4.00000- Standardized Residual (b) The diameter of iron rods issued in a high rising building pillars are under investigation. The diameter for Eleven rods were measured and the following results are obtained: Days 14.5 16.0 15.4 16.3 15.4 15.9 15.5 14.9 15.7 16.0 15.9 i. Determine The Interquartile range of the data ii. Determine a measure to describe the asymmetry of the data set.arrow_forwardWhat are the Standard Errors for Fixed Effects Regression?arrow_forward
- s is the typical amount by which the (BMI Change, Depression Score Change) value what is predicted using the least squares regression line.arrow_forward4. Housing Prices in New YorkWe have looked at predicting the price (in s) of New York homes based on the size (in thousands of square feet), using the data in HomesForSaleNY. Two other variables in the dataset are the number of bedrooms and the number of bathrooms. Use technology to create a multiple regression model to predict price based on all three variables: size, number of bedrooms, and number of bathrooms. Price Size Beds Baths 145 1.3 3 1.5 875 2.9 7 3.75 300 1.5 3 2.5 370 1.1 2 1 268 1.5 2 2 1399 4.8 6 5 1125 3.1 3 2.5 299 1.4 3 2 110 1.2 3 1 2999 6 7 8 170 1 2 1 269 1.5 3 1.5 150 1 2 1.5 288 1.8 3 2.1 350 1.3 3 2 120 0.9 1 1 309 2.4 4 2.5 1500 1.5 2 1.5 635 2.5 4 2.5 350 0.9 2 1 459 1.8 4 2.5 275 2.9 4 1.5 275 1.8 3 2 2500 3.7 3 3 187 1.4 3 1.5 238 1.7 3 1.5 155 0.7 1 1 175 1.6 3 1.5 569 3.2 4 2 105 1.2 2 2.5 a) Which of the variables which are significant at the 5% level? b) Which variable is the most…arrow_forward2. A study is conducted in patients with HIV. The primary outcome is CD4 cell count which is a measure of the stage of the disease. Lower CD4 counts are associated with more advanced disease. The investigators are interested in the association between vitamin and mineral supplements and CD4 count. A multiple regression analysis is performed relating CD4 count to use of supplements(coded as l ves, 0-no) and to duration of HIV, in years(ie., the number of years between the diagnosis of HIV and the study date). For the analysis, Y-CD4 count. Y 501.41 12.67 Supplements - 30.23 Duration of HIV A. What is the expected CD4 count for a patient taking supplements who has had HIV for 2.5 years? B. What is the expected CD4 count for a patient not taking supplements who was diagnosed with HIV at study enrollment? C. What is the expected CD4 count for a patient not taking supplements who has had HIV for 2.5 yearsarrow_forward
- What kind of plot is useful for deciding whether it is reasonable to find a regression plane for a set of data points involving several predictor variables?arrow_forwardDefine Residuals or errors in Alternative Regression Models?arrow_forward2) and a new HPLC instrument. Compare the 2 data sets using graphed regression analysis in Excel to see if the methods can be determined as equal. Discuss your conclusion. You should provide a screengrab of your graph(s). The level of phthalates in 20 water samples was determined by an old HPLC instrument Old HPLC New HPLC 1 10.1 10.5 2 11.3 11.0 3 12.4 11.4 4 9.8 9.3 5 8.6 8.3 9.2 8.9 7 10.2 10.3 8 10.6 10.3 8.9 9.3 10 10.8 10.9 11 11.5 11.0 12 12.4 12.1 13 10.2 10.8 14 9.8 9.9 15 8.4 7.9 16 8.4 8.0 17 10.4 10.9 18 9.8 10.5 19 9.3 10.6 20 11.2 11.1arrow_forward
 Linear Algebra: A Modern IntroductionAlgebraISBN:9781285463247Author:David PoolePublisher:Cengage Learning
 Calculus For The Life SciencesCalculusISBN:9780321964038Author:GREENWELL, Raymond N., RITCHEY, Nathan P., Lial, Margaret L.Publisher:Pearson Addison Wesley,
 Big Ideas Math A Bridge To Success Algebra 1: Stu...AlgebraISBN:9781680331141Author:HOUGHTON MIFFLIN HARCOURTPublisher:Houghton Mifflin Harcourt