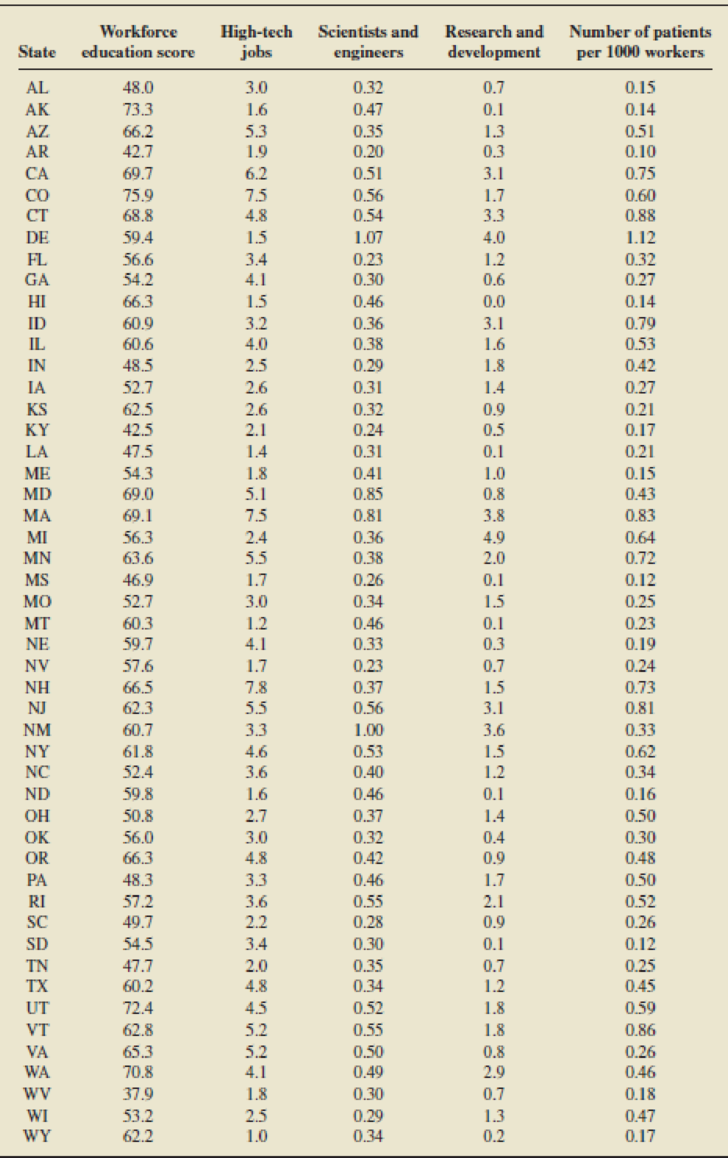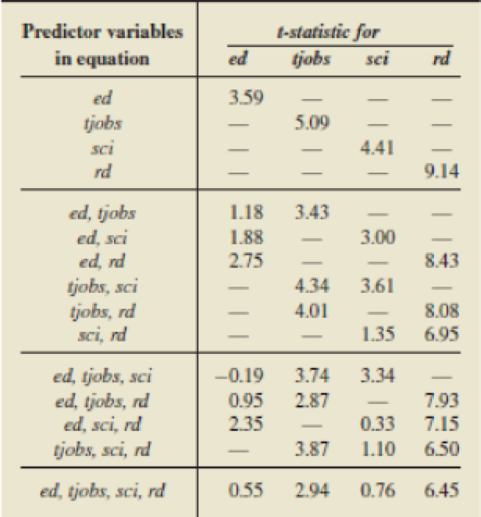
Patent Production. In the report “The State New Economy Index" (July, 1999), prepared by R. Atkinson, R. Court, and J. Ward of the Progressive Policy Institute (www.dlcppi.org), data are presented for each of the 50 U.S. states on a number of variables used to measure modern economic characteristics, especially the impact of technology. We consider here the relationship between the number of patents per 1000 workers and the following four predictor variables: workforce education score, high-tech jobs (as a share of total employment), percentage of scientists and engineers in the workforce, and investment in research and development (as a share of gross state product). The data ate presented in the table on page B-175. On the next page is a table that contains the t-statistics for the utility of individual predictor variables for regression equations that involve each predictor variable, each pair of predictor variables, each triple of predictor variables, and all four predictor variables. Employ this table to do the following.
- a. Apply the forward selection method to obtain a regression equation. (Use tenter = 2.00. )
- b. Apply the backward elimination method to obtain a regression equation. (Use tremove = 2.00.)
- c. Apply stepwise regression to obtain a regression equation. (Use tenter = tremove = 2.00.)
Table for Problem 18

- d. Are the regression equations that you obtained in parts (a), (b); and (c) the same?

Want to see the full answer?
Check out a sample textbook solution
Chapter B Solutions
Introductory Statistics (10th Edition)
 Functions and Change: A Modeling Approach to Coll...AlgebraISBN:9781337111348Author:Bruce Crauder, Benny Evans, Alan NoellPublisher:Cengage Learning
 Glencoe Algebra 1, Student Edition, 9780079039897...AlgebraISBN:9780079039897Author:CarterPublisher:McGraw Hill
 Big Ideas Math A Bridge To Success Algebra 1: Stu...AlgebraISBN:9781680331141Author:HOUGHTON MIFFLIN HARCOURTPublisher:Houghton Mifflin Harcourt


