
Concept explainers
Videos
(a)
To explain: The importance of randomly assigning the order in which the subject uses two marks.
(a)
Answer to Problem 90E
The random assignment is important to reduce the baseness.
Explanation of Solution
Given information:
The randomly assign the order in which each subject used the two masks.
It is important to randomly assign the order is explained as below,
To test for the effectiveness of floral scent on performance, 21 subjects worked two different but roughly equivalent paper-and-pencil mazes while wearing the mask.
The mask might be either unscented or scented. Each subject used both mask in a random order.
Randomization:
Randomization minimizes the difference between groups by equally distributing the individuals. By randomizations individuals are assigned to corresponding treatment randomly. Randomization reduces the observer bias, the effect of the order in which the treatments are administered and accounts for the uncontrolled factors in the experiment.
Hence, random assignment is important to reduce the baseness.
Conclusion:
The random assignment is important to reduce the baseness.
(b)
To analyse: The data will provide the convincing evidence based on the floral scent performance.
(b)
Answer to Problem 90E
At 0.05 level of significance, there is not enough evidence to conclude that the floral scent improved performance.
Explanation of Solution
Given information:
The data provide convincing evidence that the floral scent improved performance.
Test whether the floral scent improved performance or not:
Null and alternate hypotheses:
The investigator is specifically interested to test whether the floral scent improved the performance or not.
Since, d = Unscented − Scented, the mean difference (Unscented − Scented) for the rats µd would be negative if the floral scent is effective.
Denote µd as the population mean difference in the performance with scented and unscented.
The null and alternate hypotheses are stated below:
Null hypothesis H0:
H0 : µd = 0
That is, there is no significant difference in the mean performance with scented masks and unscented masks.
H1 : µd < 0
That is, the mean performance with scented masks is significantly greater than the mean performance with unscented masks.
In order to test the hypothesis regarding the significant difference between a paired set of n observations (xi, yi), a paired t-test is appropriate.
Thus, the sampling distribution used in the given scenario is “Student’s t” by assuming that d has an approximately
Paired t test:
EXCEL software can be used to perform a paired t test for the given data.
Software Procedure:
The step-by-step procedure to perform a paired t test using EXCEL software is given below:
- Open an EXCEL file.
- Enter the data of Unscented in column A and name it as Unscented.
- Enter the data of Scented in column B and name it as Scented.
- Select Data > Data Analysis > t-Test: Paired Two Sample for Means > OK.
- In Variable 1
Range enter $A$1:$A$22 and in Variable 2 Range enter $B$1:$B$22. - Click on Labels and enter Alpha as 05.
- Click OK.
The obtained output is shown below:
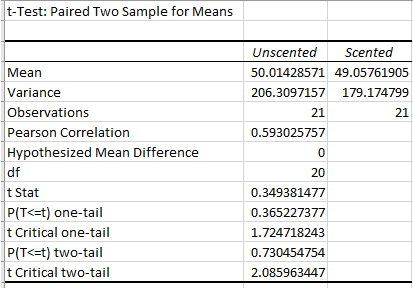
From the above obtained output below values are reported:
The test statistic is t = 0.3494.
The degrees of freedom is d.f = 20.
P-value:
From the above obtained output, the P-value for right tailed test is P-value = 0.3652.
Since, he hypothesis test is Left tailed, the P-value is P-value = 1 − 0.3652 = 0.6348.
Thus, the P-value is P-value = 0.6348.
Decision rule:
The level of significance is a = 0.05.
Decision rule based on P-value approach:
If P-value ≤ a, then reject the null hypothesis H0.
If P-value > a, then fail to reject the null hypothesis H0.
Conclusion:
Conclusion based on P-value approach:
The P-value is 0.6348 and a value is 0.05.
Here, P-value is greater than the a value.
That is, 0.6348 (=P-value) > 0.05 (=a).
By the rejection rule, fail to reject the null hypothesis.
Thus, there is no significant difference in the mean performance with scented masks and unscented masks.
Hence, at 0.05 level of significance, there is not enough evidence to conclude that the floral scent improved performance.
Conclusion:
There is not enough evidence to conclude that the floral scent improved performance.
Chapter 9 Solutions
The Practice of Statistics for AP - 4th Edition
Additional Math Textbook Solutions
Introductory Statistics
Introductory Statistics
Elementary Statistics
Elementary Statistics: Picturing the World (6th Edition)
Statistics for Psychology
Elementary Statistics: Picturing the World (7th Edition)


 MATLAB: An Introduction with ApplicationsStatisticsISBN:9781119256830Author:Amos GilatPublisher:John Wiley & Sons Inc
 Probability and Statistics for Engineering and th...StatisticsISBN:9781305251809Author:Jay L. DevorePublisher:Cengage Learning
 Statistics for The Behavioral Sciences (MindTap C...StatisticsISBN:9781305504912Author:Frederick J Gravetter, Larry B. WallnauPublisher:Cengage Learning
 Elementary Statistics: Picturing the World (7th E...StatisticsISBN:9780134683416Author:Ron Larson, Betsy FarberPublisher:PEARSON
 The Basic Practice of StatisticsStatisticsISBN:9781319042578Author:David S. Moore, William I. Notz, Michael A. FlignerPublisher:W. H. Freeman
 Introduction to the Practice of StatisticsStatisticsISBN:9781319013387Author:David S. Moore, George P. McCabe, Bruce A. CraigPublisher:W. H. Freeman