
Videos
State the P–value for each test by performing a test of the null hypothesis that the group means or group proportions are equal versus the alternative that they are not equal.
Answer to Problem 1CS
The P–value for the each test is as follows:
| Characteristic | P–value |
| Age | 0.057 |
| Systolic blood pressure | 0.000 |
| Diastolic blood pressure | 0.037 |
| Treatment for hypertension | 0.819 |
| Atrial fibrillation | 0.337 |
| Diabetes | 0.875 |
| Cigarette smoking | 0.343 |
| Coronary bypass surgery | 0.762 |
Explanation of Solution
Calculation:
The data represents the means and standard deviations corresponding to three characteristics of standard treatment and new treatment.
Furthermore, the data corresponding to the percentage with the characteristics for the 5 characteristics for standard treatment and new treatment is given.
Here, it is given that the
Let
Hypothesis test for the variable “Age”:
The hypotheses are given below:
Null hypothesis:
That is, there is no significant difference between the mean age of new treatment and standard treatment.
Alternate hypothesis:
That is, there is a significant difference between the mean age of new treatment and standard treatment.
P-value:
Software Procedure:
Step by step procedure to perform hypothesis test for the difference between the two populations means using the MINITAB software:
- Choose Stat > Basic Statistics > 2-Sample t.
- Choose Summarized data.
- In first sample, enter the sample size as 731, sample mean as 64 and sample standard deviation as 11.
- In second sample, enter the sample size as 1,089, sample mean as 65 and sample standard deviation as 11.
- Choose Options.
- In Confidence level, enter 95.
- Enter 0 in Hypothesized value.
- In Alternative, select not equal to
- Click OK in all the dialogue boxes.
Output using the MINITAB software is given below:
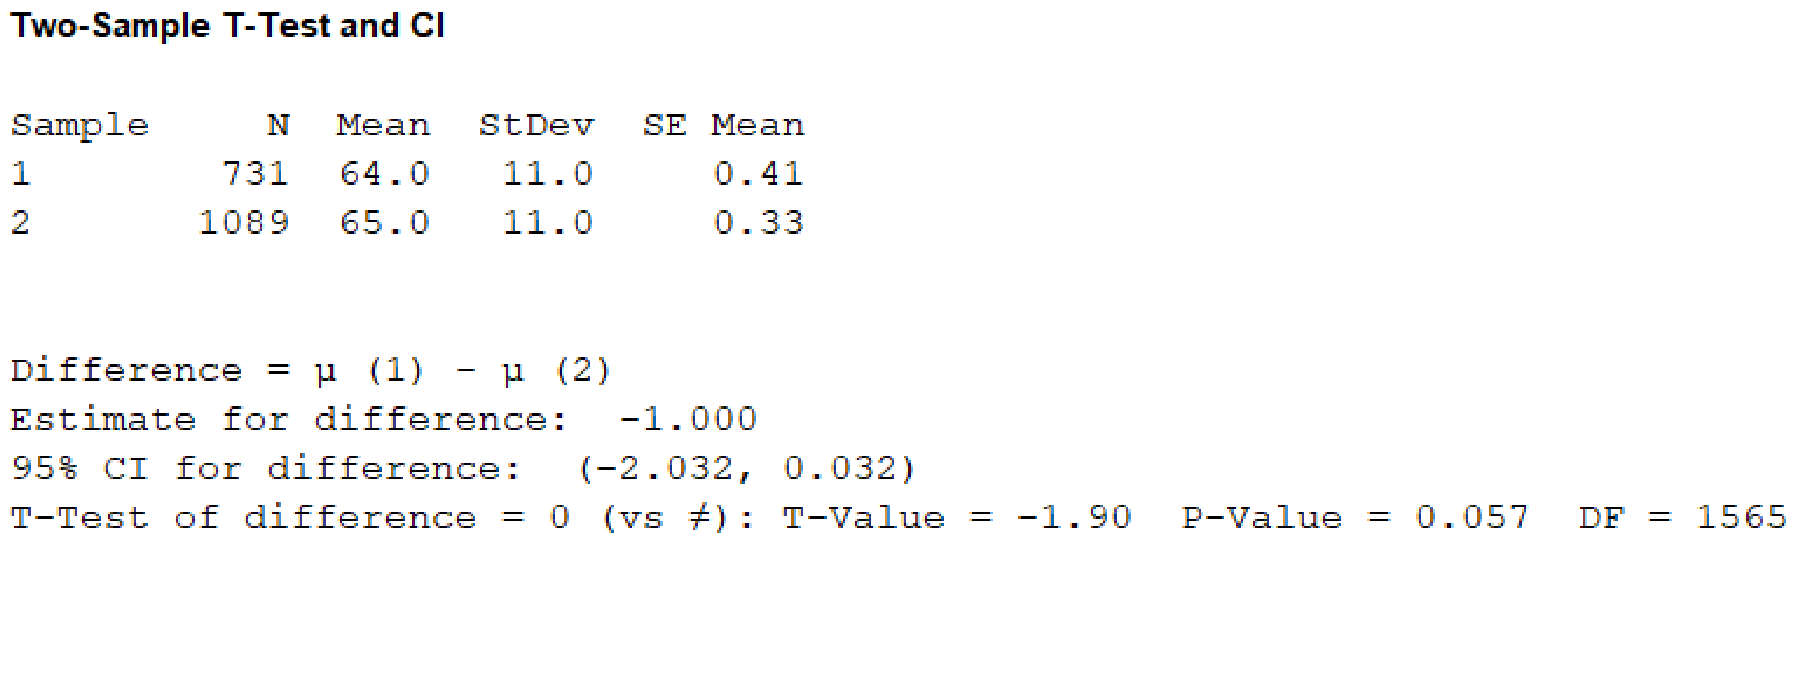
From, the MINITAB output the P-value corresponding to the variable “Age” is 0.057.
Hypothesis test for the variable “Systolic blood pressure”:
The hypotheses are given below:
Null hypothesis:
That is, there is no significant difference between the mean systolic blood pressure of new treatment and standard treatment.
Alternate hypothesis:
That is, there is a significant difference between the mean systolic blood pressure of new treatment and standard treatment.
P-value:
Software Procedure:
Step by step procedure to perform hypothesis test for the difference between the two population means using the MINITAB software:
- Choose Stat > Basic Statistics > 2-Sample t.
- Choose Summarized data.
- In first sample, enter the sample size as 731, sample mean as 121 and sample standard deviation as 18.
- In second sample, enter the sample size as 1,089, sample mean as 124 and sample standard deviation as 17.
- Choose Options.
- In Confidence level, enter 95.
- Enter 0 in Hypothesized value.
- In Alternative, select not equal to
- Click OK in all the dialogue boxes.
Output using the MINITAB software is given below:
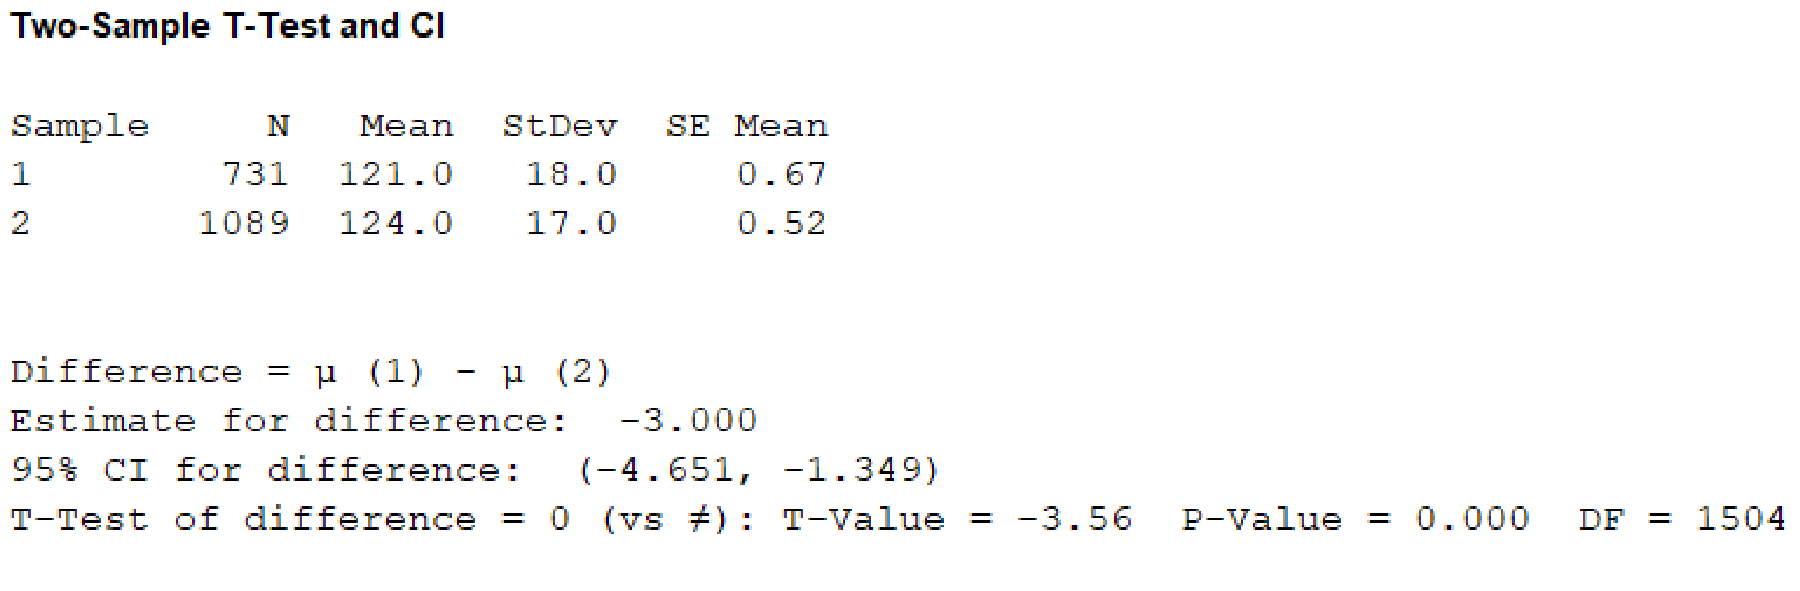
From, the MINITAB output the P-value corresponding to the variable “Systolic blood pressure” is 0.000.
Hypothesis test for the variable “Diastolic blood pressure”:
The hypotheses are given below:
Null hypothesis:
That is, there is no significant difference between the mean diastolic blood pressure of new treatment and standard treatment.
Alternate hypothesis:
That is, there is a significant difference between the mean diastolic blood pressure of new treatment and standard treatment.
P-value:
Software Procedure:
Step by step procedure to perform hypothesis test for the difference between the two populations means using the MINITAB software:
- Choose Stat > Basic Statistics > 2-Sample t.
- Choose Summarized data.
- In first sample, enter the sample size as 731, sample mean as 71 and sample standard deviation as 10.
- In second sample, enter the sample size as 1,089, sample mean as 72 and sample standard deviation as 10.
- Choose Options.
- In Confidence level, enter 95.
- Enter 0 in Hypothesized value.
- In Alternative, select not equal to
- Click OK in all the dialogue boxes.
Output using the MINITAB software is given below:
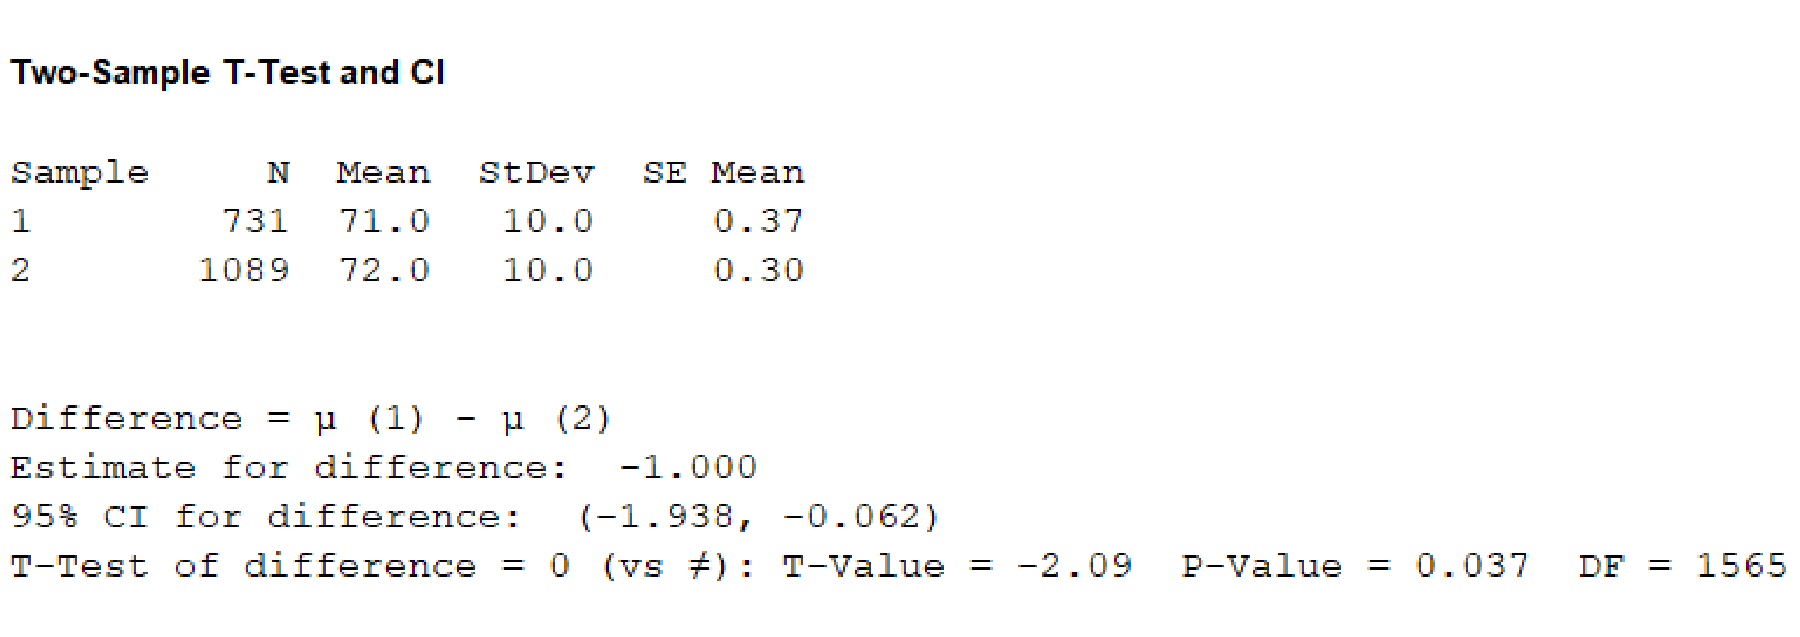
From, the MINITAB output the P-value corresponding to the variable “Diastolic blood pressure” is 0.037.
Hypothesis test for the variable “Treatment for hypertension”:
The sample size of standard treatment is
Hence, the specified characteristics of treatment for hypertension under new treatment is
The sample size of new treatment is
Hence, the specified characteristics of treatment for hypertension under new treatment is
The hypotheses are given below:
Null hypothesis:
That is, there is no significant difference between the proportion of treatment for hypertension under new treatment and standard treatment.
Alternate hypothesis:
That is, there is a significant difference between the proportion of treatment for hypertension under new treatment and standard treatment.
P-value:
Software Procedure:
Step by step procedure to perform hypothesis test for the difference between the two population proportions using the MINITAB software:
- Choose Stat > Basic Statistics > 2-Proportions.
- Choose Summarized data.
- In first sample, enter the number of trials as 731 and number of events as 462.
- In second sample, enter the number of trials as 1,089 and number of events as 694.
- Choose Options.
- In Confidence level, enter 95.
- Enter 0 in Hypothesized value.
- In Alternative, select not equal to
- Click OK in all the dialogue boxes.
Output using the MINITAB software is given below:
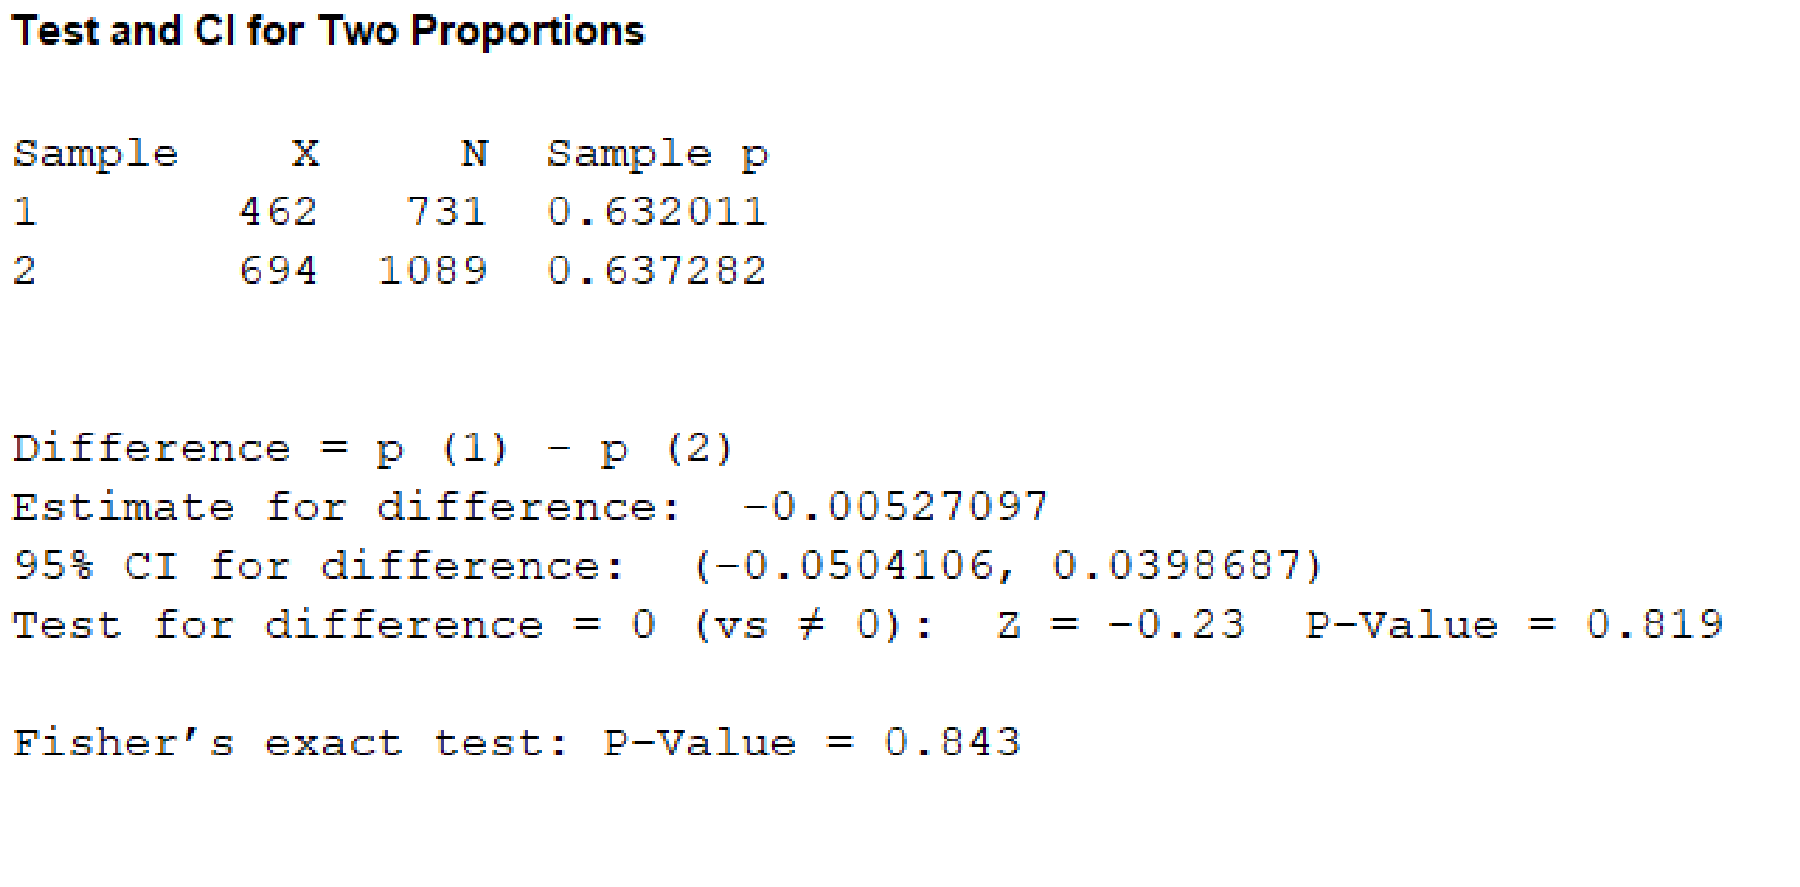
From, the MINITAB output the P-value corresponding to the variable “Treatment for hyper tension” is 0.819.
Hypothesis test for the variable “Atrial fibrillation”:
The sample size of standard treatment is
Hence, the specified characteristics of treatment for Atrial fibrillation under standard treatment is
The sample size of new treatment is
Hence, the specified characteristics of Atrial fibrillation under new treatment is
The hypotheses are given below:
Null hypothesis:
That is, there is no significant difference between the proportion of Atrial fibrillation under new treatment and standard treatment.
Alternate hypothesis:
That is, there is a significant difference between the proportion of Atrial fibrillation under new treatment and standard treatment.
P-value:
Software Procedure:
Step by step procedure to perform hypothesis test for the difference between the two populationproportions using the MINITAB software:
- Choose Stat > Basic Statistics > 2-Proportions.
- Choose Summarized data.
- In first sample, enter the number of trials as 731 and number of events as 92.
- In second sample, enter the number of trials as 1,089 and number of events as 121.
- Choose Options.
- In Confidence level, enter 95.
- Enter 0 in Hypothesized value.
- In Alternative, select not equal to
- Click OK in all the dialogue boxes.
Output using the MINITAB software is given below:
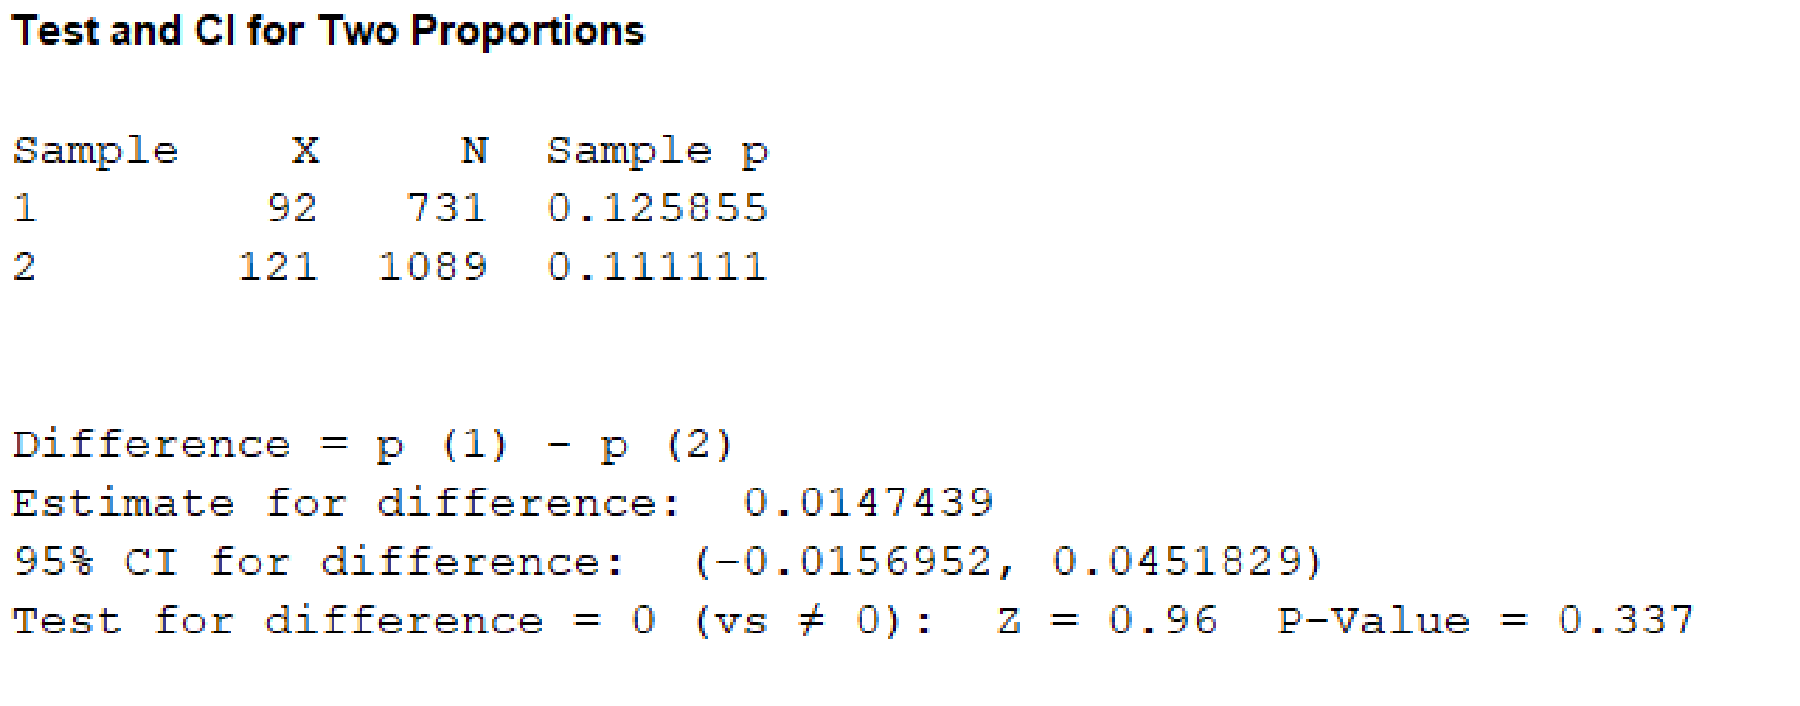
From, the MINITAB output the P-value corresponding to the variable “Atrial fibrillation” is 0.337.
Hypothesis test for the variable “Diabetes”:
The sample size of standard treatment is
Hence, the specified characteristics of diabetes under standard treatment is
The sample size of new treatment is
Hence, the specified characteristics of diabetes under new treatment is
The hypotheses are given below:
Null hypothesis:
That is, there is no significant difference between the proportion of Diabetes under new treatment and standard treatment.
Alternate hypothesis:
That is, there is a significant difference between the proportion of Diabetes under new treatment and standard treatment.
P-value:
Software Procedure:
Step by step procedure to perform hypothesis test for the difference between the two populationproportions using the MINITAB software:
- Choose Stat > Basic Statistics > 2-Proportions.
- Choose Summarized data.
- In first sample, enter the number of trials as 731 and number of events as 221.
- In second sample, enter the number of trials as 1,089 and number of events as 333.
- Choose Options.
- In Confidence level, enter 95.
- Enter 0 in Hypothesized value.
- In Alternative, select not equal to
- Click OK in all the dialogue boxes.
Output using the MINITAB software is given below:
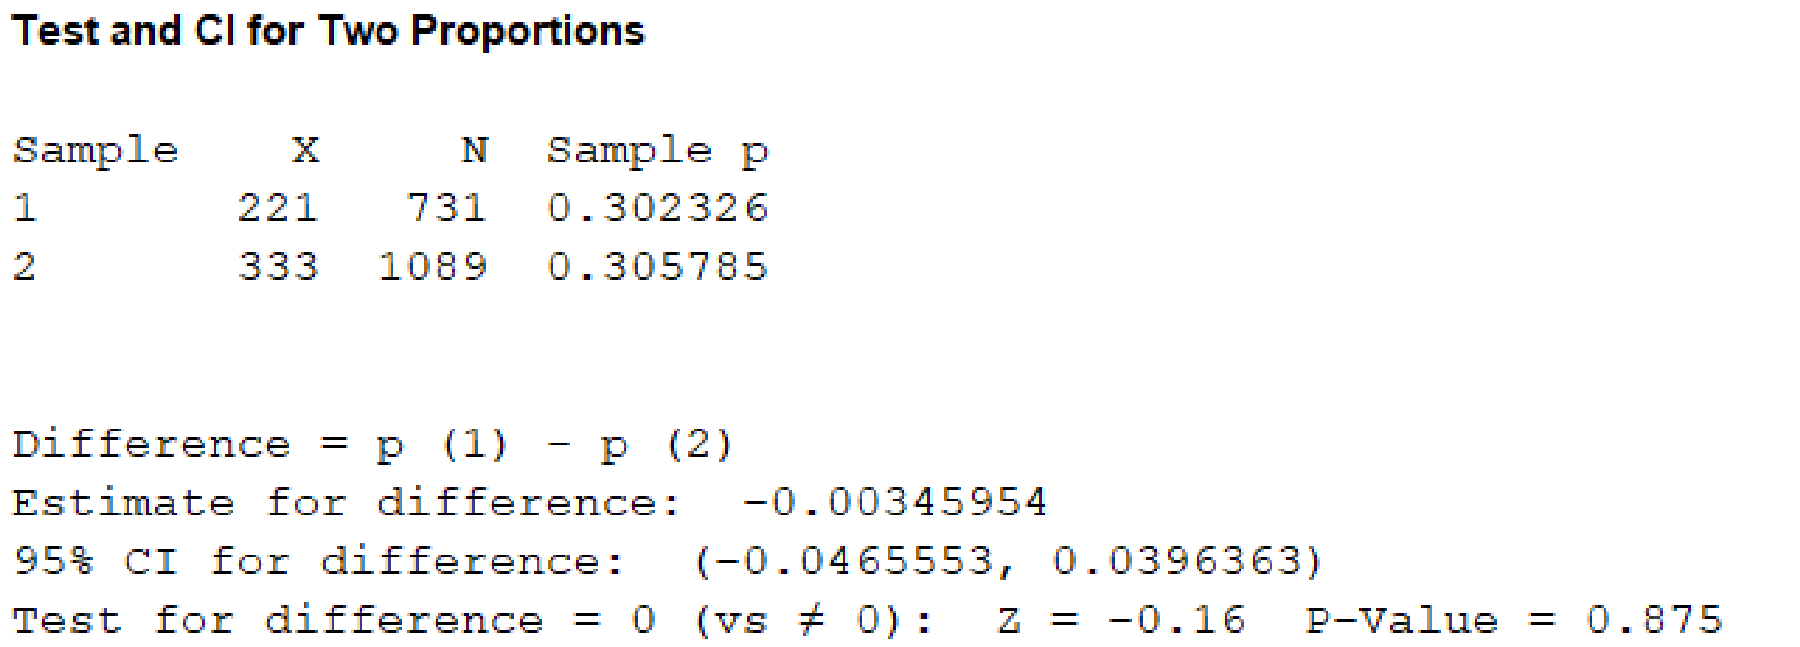
From, the MINITAB output the P-value corresponding to the variable “Diabetes” is 0.875.
Hypothesis test for the variable “Cigarette smoking”:
The sample size of standard treatment is
Hence, the specified characteristics of cigarette smoking under standard treatment is
The sample size of new treatment is
Hence, the specified characteristics of cigarette smoking under new treatment is
The hypotheses are given below:
Null hypothesis:
That is, there is no significant difference between the proportion of Cigarette smoking under new treatment and standard treatment.
Alternate hypothesis:
That is, there is a significant difference between the proportion of Cigarette smoking under new treatment and standard treatment.
P-value:
Software Procedure:
Step by step procedure to perform hypothesis test for the difference between the two populationsproportions using the MINITAB software:
- Choose Stat > Basic Statistics > 2-Proportions.
- Choose Summarized data.
- In first sample, enter the number of trials as 731 and number of events as 94.
- In second sample, enter the number of trials as 1,089 and number of events as 124.
- Choose Options.
- In Confidence level, enter 95.
- Enter 0 in Hypothesized value.
- In Alternative, select not equal to
- Click OK in all the dialogue boxes.
Output using the MINITAB software is given below:

From, the MINITAB output the P-value corresponding to the variable “Cigarette smoking” is 0.343.
Hypothesis test for the variable “Coronary bypass surgery”:
The sample size of standard treatment is
Hence, the specified characteristics of Coronary bypass surgery under standard treatment is
The sample size of new treatment is
Hence, the specified characteristics of coronary bypass surgery under new treatment is
The hypotheses are given below:
Null hypothesis:
That is, there is no significant difference between the proportion of Coronary bypass surgery under new treatment and standard treatment.
Alternate hypothesis:
That is, there is a significant difference between the proportion of Coronary bypass surgery under new treatment and standard treatment.
P-value:
Software Procedure:
Step by step procedure to perform hypothesis test for the difference between the two populationproportions using the MINITAB software:
- Choose Stat > Basic Statistics > 2-Proportions.
- Choose Summarized data.
- In first sample, enter the number of trials as 1,089 and number of events as 317.
- In second sample, enter the number of trials as 731 and number of events as 208.
- Choose Options.
- In Confidence level, enter 95.
- Enter 0 in Hypothesized value.
- In Alternative, select not equal to
- Click OK in all the dialogue boxes.
Output using the MINITAB software is given below:
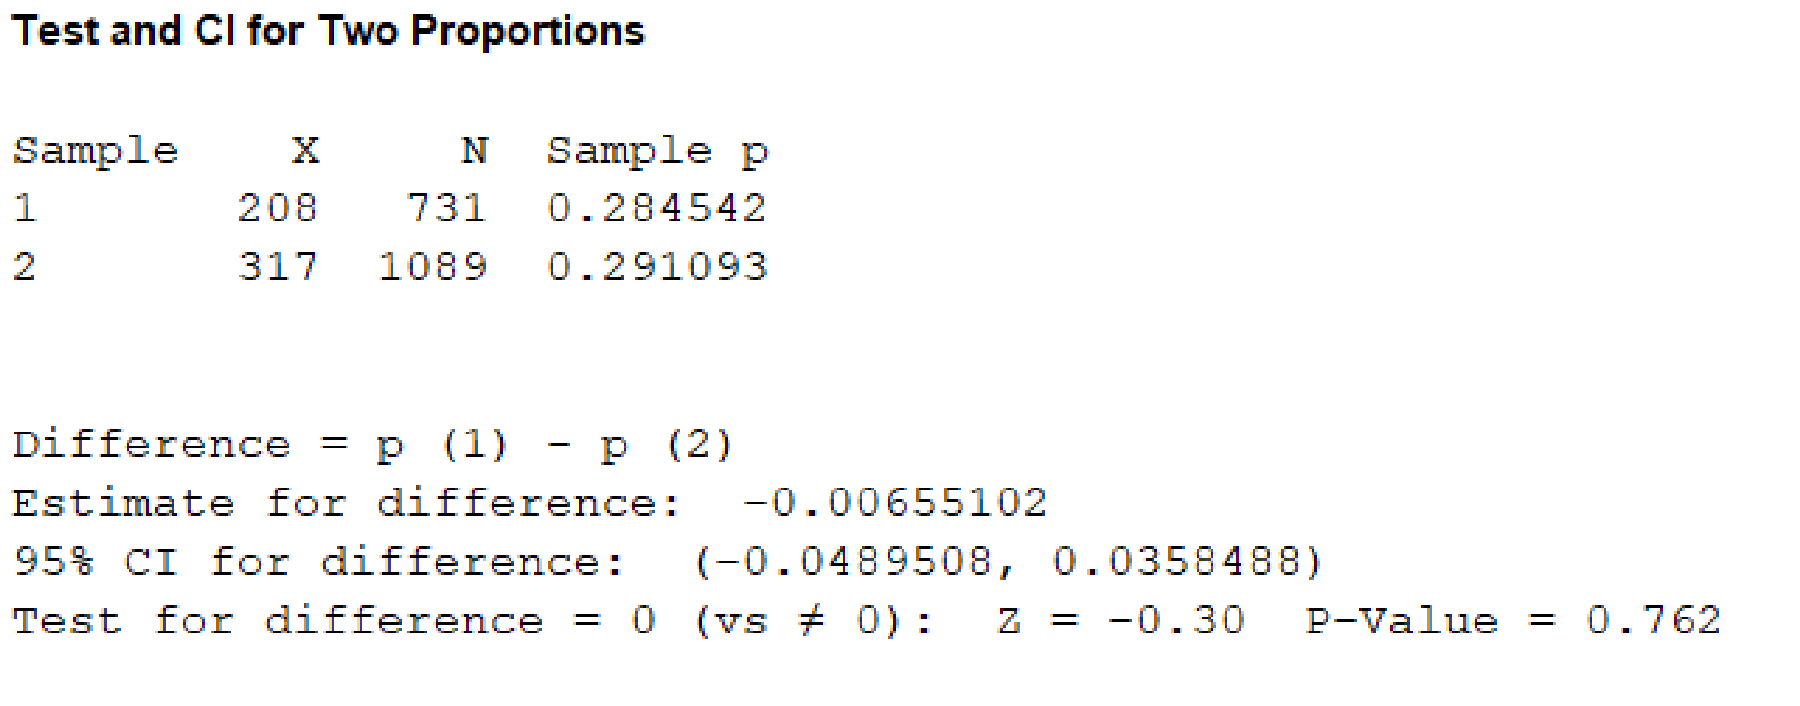
From, the MINITAB output the P-value corresponding to the variable “Coronary bypass surgery” is 0.762.
Want to see more full solutions like this?
Chapter 9 Solutions
Essential Statistics


- An electronics company manufactures batches of n circuit boards. Before a batch is approved for shipment, m boards are randomly selected from the batch and tested. The batch is rejected if more than d boards in the sample are found to be faulty. a) A batch actually contains six faulty circuit boards. Find the probability that the batch is rejected when n = 20, m = 5, and d = 1. b) A batch actually contains nine faulty circuit boards. Find the probability that the batch is rejected when n = 30, m = 10, and d = 1.arrow_forwardTwenty-eight applicants interested in working for the Food Stamp program took an examination designed to measure their aptitude for social work. A stem-and-leaf plot of the 28 scores appears below, where the first column is the count per branch, the second column is the stem value, and the remaining digits are the leaves. a) List all the values. Count 1 Stems Leaves 4 6 1 4 6 567 9 3688 026799 9 8 145667788 7 9 1234788 b) Calculate the first quartile (Q1) and the third Quartile (Q3). c) Calculate the interquartile range. d) Construct a boxplot for this data.arrow_forwardPam, Rob and Sam get a cake that is one-third chocolate, one-third vanilla, and one-third strawberry as shown below. They wish to fairly divide the cake using the lone chooser method. Pam likes strawberry twice as much as chocolate or vanilla. Rob only likes chocolate. Sam, the chooser, likes vanilla and strawberry twice as much as chocolate. In the first division, Pam cuts the strawberry piece off and lets Rob choose his favorite piece. Based on that, Rob chooses the chocolate and vanilla parts. Note: All cuts made to the cake shown below are vertical.Which is a second division that Rob would make of his share of the cake?arrow_forward
- Three players (one divider and two choosers) are going to divide a cake fairly using the lone divider method. The divider cuts the cake into three slices (s1, s2, and s3). If the choosers' declarations are Chooser 1: {s1 , s2} and Chooser 2: {s2 , s3}. Using the lone-divider method, how many different fair divisions of this cake are possible?arrow_forwardTheorem 2.6 (The Minkowski inequality) Let p≥1. Suppose that X and Y are random variables, such that E|X|P <∞ and E|Y P <00. Then X+YpX+Yparrow_forwardTheorem 1.2 (1) Suppose that P(|X|≤b) = 1 for some b > 0, that EX = 0, and set Var X = 0². Then, for 0 0, P(X > x) ≤e-x+1²² P(|X|>x) ≤2e-1x+1²² (ii) Let X1, X2...., Xn be independent random variables with mean 0, suppose that P(X ≤b) = 1 for all k, and set oσ = Var X. Then, for x > 0. and 0x) ≤2 exp Σ k=1 (iii) If, in addition, X1, X2, X, are identically distributed, then P(S|x) ≤2 expl-tx+nt²o).arrow_forward
- Theorem 5.1 (Jensen's inequality) state without proof the Jensen's Ineg. Let X be a random variable, g a convex function, and suppose that X and g(X) are integrable. Then g(EX) < Eg(X).arrow_forwardCan social media mistakes hurt your chances of finding a job? According to a survey of 1,000 hiring managers across many different industries, 76% claim that they use social media sites to research prospective candidates for any job. Calculate the probabilities of the following events. (Round your answers to three decimal places.) answer parts a-c. a) Out of 30 job listings, at least 19 will conduct social media screening. b) Out of 30 job listings, fewer than 17 will conduct social media screening. c) Out of 30 job listings, exactly between 19 and 22 (including 19 and 22) will conduct social media screening. show all steps for probabilities please. answer parts a-c.arrow_forwardQuestion: we know that for rt. (x+ys s ا. 13. rs. and my so using this, show that it vye and EIXI, EIYO This : E (IX + Y) ≤2" (EIX (" + Ely!")arrow_forward
- Theorem 2.4 (The Hölder inequality) Let p+q=1. If E|X|P < ∞ and E|Y| < ∞, then . |EXY ≤ E|XY|||X|| ||||qarrow_forwardTheorem 7.6 (Etemadi's inequality) Let X1, X2, X, be independent random variables. Then, for all x > 0, P(max |S|>3x) ≤3 max P(S| > x). Isk≤narrow_forwardTheorem 7.2 Suppose that E X = 0 for all k, that Var X = 0} x) ≤ 2P(S>x 1≤k≤n S√2), -S√2). P(max Sk>x) ≤ 2P(|S|>x- 1arrow_forwardarrow_back_iosSEE MORE QUESTIONSarrow_forward_ios
 MATLAB: An Introduction with ApplicationsStatisticsISBN:9781119256830Author:Amos GilatPublisher:John Wiley & Sons Inc
 Probability and Statistics for Engineering and th...StatisticsISBN:9781305251809Author:Jay L. DevorePublisher:Cengage Learning
 Statistics for The Behavioral Sciences (MindTap C...StatisticsISBN:9781305504912Author:Frederick J Gravetter, Larry B. WallnauPublisher:Cengage Learning
 Elementary Statistics: Picturing the World (7th E...StatisticsISBN:9780134683416Author:Ron Larson, Betsy FarberPublisher:PEARSON
 The Basic Practice of StatisticsStatisticsISBN:9781319042578Author:David S. Moore, William I. Notz, Michael A. FlignerPublisher:W. H. Freeman
 Introduction to the Practice of StatisticsStatisticsISBN:9781319013387Author:David S. Moore, George P. McCabe, Bruce A. CraigPublisher:W. H. Freeman