
a.
To state: A linear regression equation for the population of Anaheim if x is the number of years since 1970 and the below given table shows the population (in thousands) of Anaheim, California, and Anchorage, Alaska.
| Year | Anaheim (thousand) | Anchorage (thousands) |
| 1970 | 166 | 48 |
| 1980 | 219 | 174 |
| 1990 | 266 | 226 |
| 2000 | 328 | 260 |
| 2010 | 336 | 292 |
The resultant answer is
Given information:
The given table is:
| Year | Anaheim (thousand) | Anchorage (thousands) |
| 1970 | 166 | 48 |
| 1980 | 219 | 174 |
| 1990 | 266 | 226 |
| 2000 | 328 | 260 |
| 2010 | 336 | 292 |
Explanation:
Consider the given table:
| Year | Anaheim (thousand) | Anchorage (thousands) |
| 1970 | 166 | 48 |
| 1980 | 219 | 174 |
| 1990 | 266 | 226 |
| 2000 | 328 | 260 |
| 2010 | 336 | 292 |
Use a graphing calculator; enter the time (years) starting at
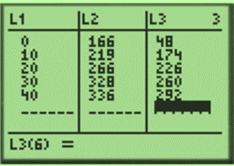
Use LinReg feature (with L1 and L2) to obtain the linear regression model for the population of Anaheim:
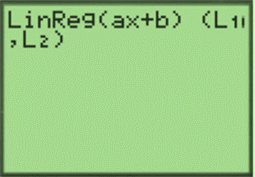
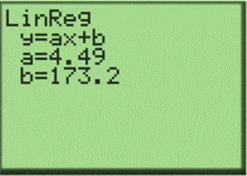
Therefore, the resultant regression equation is:
b.
To state: A linear regression equation for the population of Anchorage if x is the number of years since 1970 and the below given table shows the population (in thousands) of two fast-growing suburbs.
| Year | Anaheim (thousand) | Anchorage (thousands) |
| 1970 | 166 | 48 |
| 1980 | 219 | 174 |
| 1990 | 266 | 226 |
| 2000 | 328 | 260 |
| 2010 | 336 | 292 |
The answer is
Given information:
The given table is:
| Year | Anaheim (thousand) | Anchorage (thousands) |
| 1970 | 166 | 48 |
| 1980 | 219 | 174 |
| 1990 | 266 | 226 |
| 2000 | 328 | 260 |
| 2010 | 336 | 292 |
Explanation:
Continue from part (a), use LinReg feature (with L1 and L3) to obtain the linear regression model for the population of Anchorage.
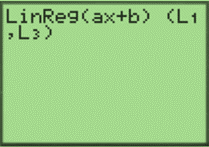
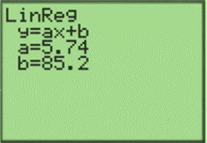
Therefore, the resultant linear regression equation is:
c.
To graph: The models from part (a) and Part (b) and use these models to determine when the population of the two cities will be about the same.
Given information:
The models from part (a) and part (b) are
Graph:
Consider the models
Now enter
And use the intersect feature to find the point of intersection:
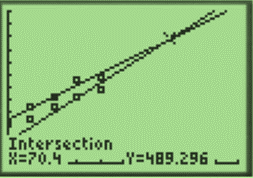
The x -coordinate of the point of intersection is about 70 which corresponds to the year
Therefore, the population of the two cities will be about the same in the year 2040.
Interpretation: Both the equations are linear equations and their intersection point is
Chapter 7 Solutions
PRECALCULUS:GRAPHICAL,...-NASTA ED.
 Calculus: Early TranscendentalsCalculusISBN:9781285741550Author:James StewartPublisher:Cengage Learning
 Thomas' Calculus (14th Edition)CalculusISBN:9780134438986Author:Joel R. Hass, Christopher E. Heil, Maurice D. WeirPublisher:PEARSON
 Calculus: Early Transcendentals (3rd Edition)CalculusISBN:9780134763644Author:William L. Briggs, Lyle Cochran, Bernard Gillett, Eric SchulzPublisher:PEARSON
 Calculus: Early TranscendentalsCalculusISBN:9781319050740Author:Jon Rogawski, Colin Adams, Robert FranzosaPublisher:W. H. Freeman
 Calculus: Early Transcendental FunctionsCalculusISBN:9781337552516Author:Ron Larson, Bruce H. EdwardsPublisher:Cengage Learning


